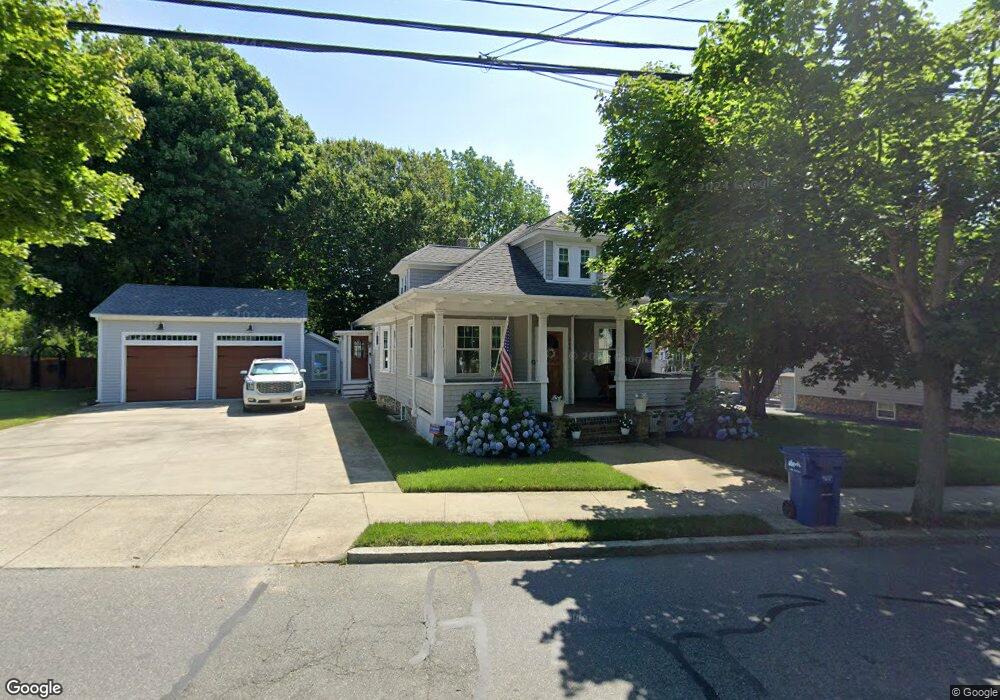
243 Main St Fairhaven, MA 02719
Oxford NeighborhoodEstimated Value: $468,000 - $511,000
4
Beds
2
Baths
1,225
Sq Ft
$399/Sq Ft
Est. Value
About This Home
This home is located at 243 Main St, Fairhaven, MA 02719 and is currently estimated at $488,481, approximately $398 per square foot. 243 Main St is a home located in Bristol County with nearby schools including Fairhaven High School, Alma Del Mar Charter School, and City On A Hill Charter Public School New Bedford.
Ownership History
Date
Name
Owned For
Owner Type
Purchase Details
Closed on
Apr 15, 2016
Sold by
Wesoly Christine A and Wesoly Paul A
Bought by
Wesoly Ft
Current Estimated Value
Purchase Details
Closed on
Jun 27, 2013
Sold by
Wesoly Paul A and Wesoly Christine A
Bought by
Wesoly Ft and Wesoly Paul A
Purchase Details
Closed on
Jul 1, 2010
Sold by
Severance Raymond B and Severance Joy F
Bought by
Wesoly Paul A and Wesoly Christine A
Create a Home Valuation Report for This Property
The Home Valuation Report is an in-depth analysis detailing your home's value as well as a comparison with similar homes in the area
Home Values in the Area
Average Home Value in this Area
Purchase History
| Date | Buyer | Sale Price | Title Company |
|---|---|---|---|
| Wesoly Ft | -- | -- | |
| Wesoly Ft | -- | -- | |
| Wesoly Paul A | $10,000 | -- |
Source: Public Records
Mortgage History
| Date | Status | Borrower | Loan Amount |
|---|---|---|---|
| Previous Owner | Wesoly Paul A | $131,300 | |
| Previous Owner | Wesoly Paul A | $180,000 | |
| Previous Owner | Wesoly Paul A | $224,000 |
Source: Public Records
Tax History
| Year | Tax Paid | Tax Assessment Tax Assessment Total Assessment is a certain percentage of the fair market value that is determined by local assessors to be the total taxable value of land and additions on the property. | Land | Improvement |
|---|---|---|---|---|
| 2025 | $40 | $432,200 | $183,100 | $249,100 |
| 2024 | $3,910 | $423,600 | $183,100 | $240,500 |
| 2023 | $3,965 | $398,500 | $169,700 | $228,800 |
| 2022 | $3,900 | $381,600 | $161,700 | $219,900 |
| 2021 | $3,770 | $333,900 | $147,000 | $186,900 |
| 2020 | $3,554 | $321,300 | $140,300 | $181,000 |
| 2019 | $3,447 | $295,400 | $127,800 | $167,600 |
| 2018 | $1,372 | $282,300 | $121,600 | $160,700 |
| 2017 | $3,081 | $255,900 | $121,600 | $134,300 |
| 2016 | $3,023 | $248,200 | $121,600 | $126,600 |
| 2015 | $2,989 | $246,000 | $121,600 | $124,400 |
Source: Public Records
Map
Nearby Homes
- 442 Dana Farms
- 24 Academy Ave
- 14 Sycamore St
- 313 Main St
- 253 Adams St
- 10 Livesey Pkwy
- 138 Main St Unit 13
- 15 School St
- 16 Ash St
- 71 Sycamore St
- 67 Bridge St
- 39 Christian St
- 34 Washburn St Unit 36
- 24 Cotter St
- 77 Adams St
- 0 Nulands Neck Unit 73286360
- 8 Washington St
- 145 Pleasant St
- 58 Washington St
- 7 Deerfield Ln
Your Personal Tour Guide
Ask me questions while you tour the home.