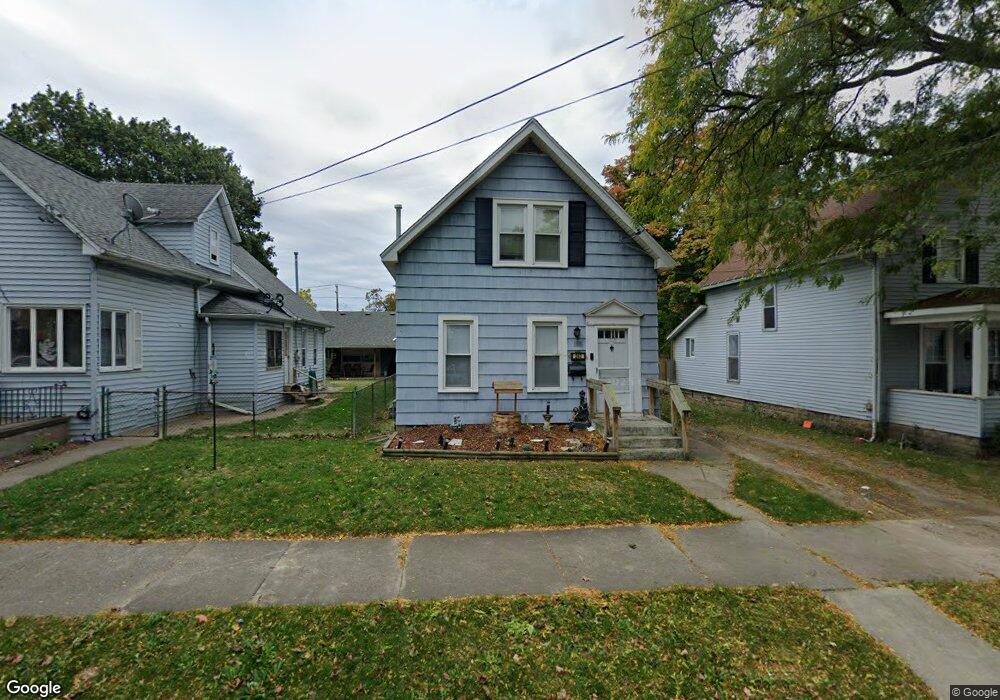
243 Miller St North Tonawanda, NY 14120
Estimated Value: $176,000 - $227,000
4
Beds
2
Baths
1,564
Sq Ft
$133/Sq Ft
Est. Value
About This Home
This home is located at 243 Miller St, North Tonawanda, NY 14120 and is currently estimated at $208,001, approximately $132 per square foot. 243 Miller St is a home located in Niagara County with nearby schools including North Tonawanda Intermediate School and St Matthew Lutheran School.
Ownership History
Date
Name
Owned For
Owner Type
Purchase Details
Closed on
Dec 1, 2011
Sold by
Fronczak Katherine and Fronczak Paul
Bought by
Maryniak Jill M
Current Estimated Value
Home Financials for this Owner
Home Financials are based on the most recent Mortgage that was taken out on this home.
Original Mortgage
$68,225
Outstanding Balance
$47,036
Interest Rate
4.25%
Mortgage Type
FHA
Estimated Equity
$160,965
Purchase Details
Closed on
Aug 16, 1995
Sold by
Fronczak Alfred
Bought by
Fronczak Alfred Katherine Life Tenant
Create a Home Valuation Report for This Property
The Home Valuation Report is an in-depth analysis detailing your home's value as well as a comparison with similar homes in the area
Home Values in the Area
Average Home Value in this Area
Purchase History
| Date | Buyer | Sale Price | Title Company |
|---|---|---|---|
| Maryniak Jill M | $70,000 | None Available | |
| Fronczak Alfred Katherine Life Tenant | -- | -- |
Source: Public Records
Mortgage History
| Date | Status | Borrower | Loan Amount |
|---|---|---|---|
| Open | Maryniak Jill M | $68,225 |
Source: Public Records
Tax History Compared to Growth
Tax History
| Year | Tax Paid | Tax Assessment Tax Assessment Total Assessment is a certain percentage of the fair market value that is determined by local assessors to be the total taxable value of land and additions on the property. | Land | Improvement |
|---|---|---|---|---|
| 2024 | $2,507 | $71,000 | $14,600 | $56,400 |
| 2023 | $2,428 | $71,000 | $14,600 | $56,400 |
| 2022 | $2,369 | $71,000 | $14,600 | $56,400 |
| 2021 | $1,881 | $71,000 | $14,600 | $56,400 |
| 2020 | $1,766 | $71,000 | $14,600 | $56,400 |
| 2019 | $959 | $71,000 | $14,600 | $56,400 |
| 2018 | $1,688 | $71,000 | $14,600 | $56,400 |
| 2017 | $1,621 | $71,000 | $14,600 | $56,400 |
| 2016 | $1,549 | $71,000 | $14,600 | $56,400 |
| 2015 | -- | $58,000 | $14,600 | $43,400 |
| 2014 | -- | $71,000 | $14,600 | $56,400 |
Source: Public Records
Map
Nearby Homes