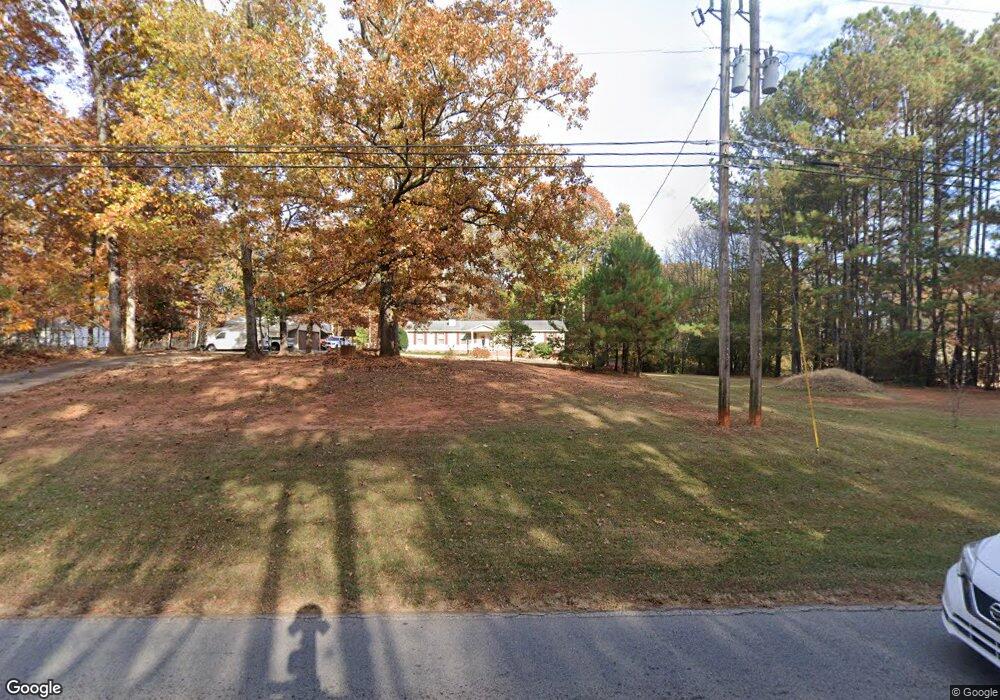
243 Mount Moriah Rd Auburn, GA 30011
Estimated Value: $306,000 - $347,431
3
Beds
4
Baths
1,318
Sq Ft
$244/Sq Ft
Est. Value
About This Home
This home is located at 243 Mount Moriah Rd, Auburn, GA 30011 and is currently estimated at $321,608, approximately $244 per square foot. 243 Mount Moriah Rd is a home located in Barrow County with nearby schools including Auburn Elementary School, Westside Middle School, and Apalachee High School.
Ownership History
Date
Name
Owned For
Owner Type
Purchase Details
Closed on
Jan 10, 2003
Sold by
Hud
Bought by
Mcdaniel Robin and Mcdaniel Wayne
Current Estimated Value
Home Financials for this Owner
Home Financials are based on the most recent Mortgage that was taken out on this home.
Original Mortgage
$83,700
Interest Rate
5.88%
Mortgage Type
New Conventional
Purchase Details
Closed on
Sep 4, 2002
Sold by
Washington Mutual Bank
Bought by
Hud
Purchase Details
Closed on
Jun 4, 2002
Sold by
Drew John C and John Charles
Bought by
Washington Mutual Bank
Purchase Details
Closed on
Feb 15, 2000
Sold by
An Drew John Charles
Bought by
Drew John Charles
Home Financials for this Owner
Home Financials are based on the most recent Mortgage that was taken out on this home.
Original Mortgage
$111,248
Interest Rate
8.29%
Mortgage Type
New Conventional
Purchase Details
Closed on
Dec 9, 1994
Bought by
An Drew John Charles
Create a Home Valuation Report for This Property
The Home Valuation Report is an in-depth analysis detailing your home's value as well as a comparison with similar homes in the area
Home Values in the Area
Average Home Value in this Area
Purchase History
| Date | Buyer | Sale Price | Title Company |
|---|---|---|---|
| Mcdaniel Robin | -- | -- | |
| Hud | -- | -- | |
| Washington Mutual Bank | $117,806 | -- | |
| Secretary Of Housing | -- | -- | |
| Drew John Charles | -- | -- | |
| An Drew John Charles | $93,000 | -- |
Source: Public Records
Mortgage History
| Date | Status | Borrower | Loan Amount |
|---|---|---|---|
| Previous Owner | Mcdaniel Robin | $83,700 | |
| Previous Owner | Drew John Charles | $111,248 |
Source: Public Records
Tax History
| Year | Tax Paid | Tax Assessment Tax Assessment Total Assessment is a certain percentage of the fair market value that is determined by local assessors to be the total taxable value of land and additions on the property. | Land | Improvement |
|---|---|---|---|---|
| 2025 | $1,083 | $119,578 | $54,330 | $65,248 |
| 2024 | $2,902 | $117,938 | $54,330 | $63,608 |
| 2023 | $2,886 | $117,938 | $54,330 | $63,608 |
| 2022 | $2,770 | $97,276 | $54,330 | $42,946 |
| 2021 | $2,507 | $83,003 | $43,464 | $39,539 |
| 2020 | $2,020 | $66,459 | $28,623 | $37,836 |
| 2019 | $1,969 | $63,565 | $28,623 | $34,942 |
| 2018 | $1,952 | $63,727 | $28,623 | $35,104 |
| 2017 | $1,732 | $59,485 | $28,623 | $30,862 |
| 2016 | $1,812 | $59,513 | $28,623 | $30,890 |
| 2015 | $1,822 | $59,553 | $28,623 | $30,930 |
| 2014 | $1,428 | $44,982 | $14,025 | $30,957 |
| 2013 | -- | $43,006 | $14,025 | $28,980 |
Source: Public Records
Map
Nearby Homes
- 120 Mount Moriah Rd
- 280 Etheridge Rd
- 70 Wood Chuck Ct
- 1813 Westfall Landing
- 1923 Westfall Landing
- 1691 Branthaven Ln
- 5899 Wheeler Ridge Rd
- 7 Hydrangea Unit 70 Way
- 29 Hydrangea Unit 72 Way
- 42 Avian Way
- 42 Avian Way Unit 128B
- 51 Way
- 335 Brook Landing Cir
- 339 Brook Landing Cir
- 359 Scenic Ln
- 491 Glen Terrace Rd
- 486 Glen Terrace Rd
- 102 Mount Moriah Rd
- 1778 Wynfield Ln
- 497 Natasha Dr
- 251 Mount Moriah Rd
- 229 Mount Moriah Rd
- 257 Mount Moriah Rd
- 248 Mount Moriah Rd
- 221 Mount Moriah Rd
- 254 Mount Moriah Rd
- 261 Mount Moriah Rd
- 351 Etheridge Rd
- 217 Mount Moriah Rd
- 203 Mount Moriah Rd
- 269 Mount Moriah Rd
- 262 Mount Moriah Rd
- 345 Etheridge Rd
- 275 Mount Moriah Rd
- 208 Mount Moriah Rd
- 201 Mount Moriah Rd Unit 1
- 201 Mount Moriah Rd
- 332 Etheridge Rd
- 327 Etheridge Rd
- 201 Country Living Ln Unit 2
Your Personal Tour Guide
Ask me questions while you tour the home.