Estimated Value: $454,589 - $668,000
Studio
--
Bath
1,433
Sq Ft
$380/Sq Ft
Est. Value
About This Home
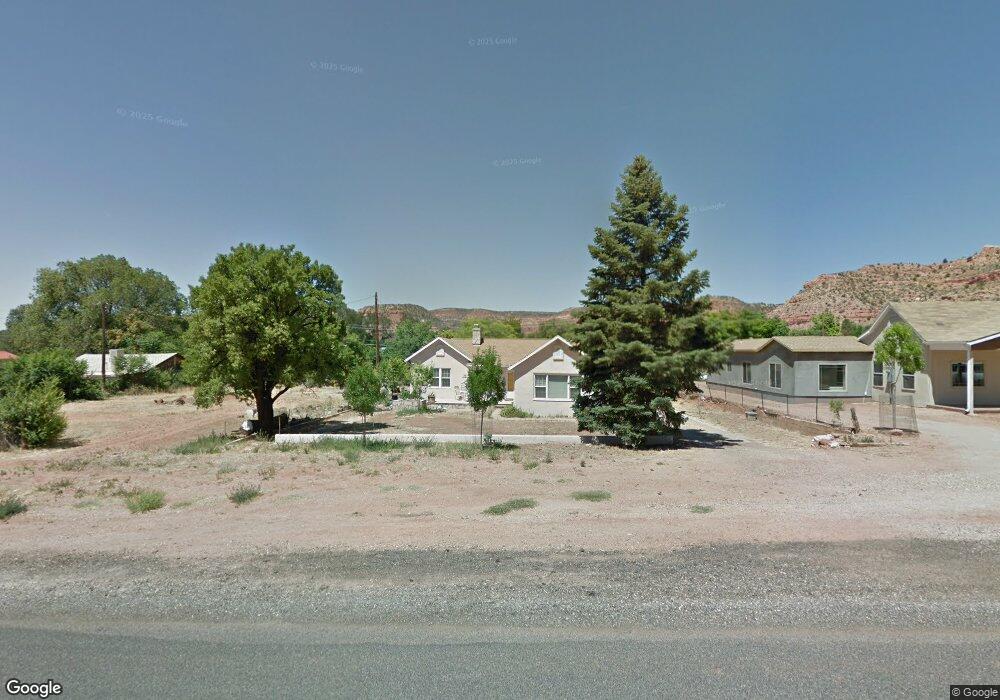
This home is located at 243 N 100 E, Kanab, UT 84741 and is currently estimated at $544,147, approximately $379 per square foot. 243 N 100 E is a home located in Kane County with nearby schools including Kanab Elementary School, Kanab Middle School, and Kanab High School.
Ownership History
Date
Name
Owned For
Owner Type
Purchase Details
Closed on
Aug 26, 2020
Sold by
Asay Lynn J
Bought by
Mahb Llc Series 1
Current Estimated Value
Purchase Details
Closed on
Aug 11, 2017
Bought by
Mahb Llc Series 1
Purchase Details
Closed on
Nov 29, 2006
Sold by
Asay Lynn J and Asay Nellie Judd
Bought by
Johnson Brian A
Home Financials for this Owner
Home Financials are based on the most recent Mortgage that was taken out on this home.
Original Mortgage
$137,600
Interest Rate
6.37%
Create a Home Valuation Report for This Property
The Home Valuation Report is an in-depth analysis detailing your home's value as well as a comparison with similar homes in the area
Home Values in the Area
Average Home Value in this Area
Purchase History
| Date | Buyer | Sale Price | Title Company |
|---|---|---|---|
| Mahb Llc Series 1 | -- | -- | |
| Mahb Llc Series 1 | -- | -- | |
| Johnson Brian A | -- | -- |
Source: Public Records
Mortgage History
| Date | Status | Borrower | Loan Amount |
|---|---|---|---|
| Previous Owner | Johnson Brian A | $137,600 |
Source: Public Records
Tax History
| Year | Tax Paid | Tax Assessment Tax Assessment Total Assessment is a certain percentage of the fair market value that is determined by local assessors to be the total taxable value of land and additions on the property. | Land | Improvement |
|---|---|---|---|---|
| 2025 | $3,789 | $441,686 | $138,521 | $303,165 |
| 2024 | $3,839 | $245,383 | $63,018 | $182,365 |
| 2023 | $3,448 | $225,804 | $60,018 | $165,786 |
| 2022 | $3,036 | $196,883 | $46,168 | $150,715 |
| 2021 | $2,749 | $267,553 | $64,570 | $202,983 |
| 2020 | $1,466 | $251,825 | $58,700 | $193,125 |
| 2019 | $1,252 | $209,435 | $52,932 | $156,503 |
| 2018 | $935 | $154,989 | $44,110 | $110,879 |
| 2017 | $889 | $140,751 | $40,100 | $100,651 |
| 2016 | $805 | $123,806 | $40,100 | $83,706 |
| 2015 | $755 | $116,742 | $40,100 | $76,642 |
| 2014 | $755 | $115,446 | $42,078 | $73,368 |
| 2013 | -- | $63,496 | $0 | $0 |
Source: Public Records
Map
Nearby Homes
Your Personal Tour Guide
Ask me questions while you tour the home.