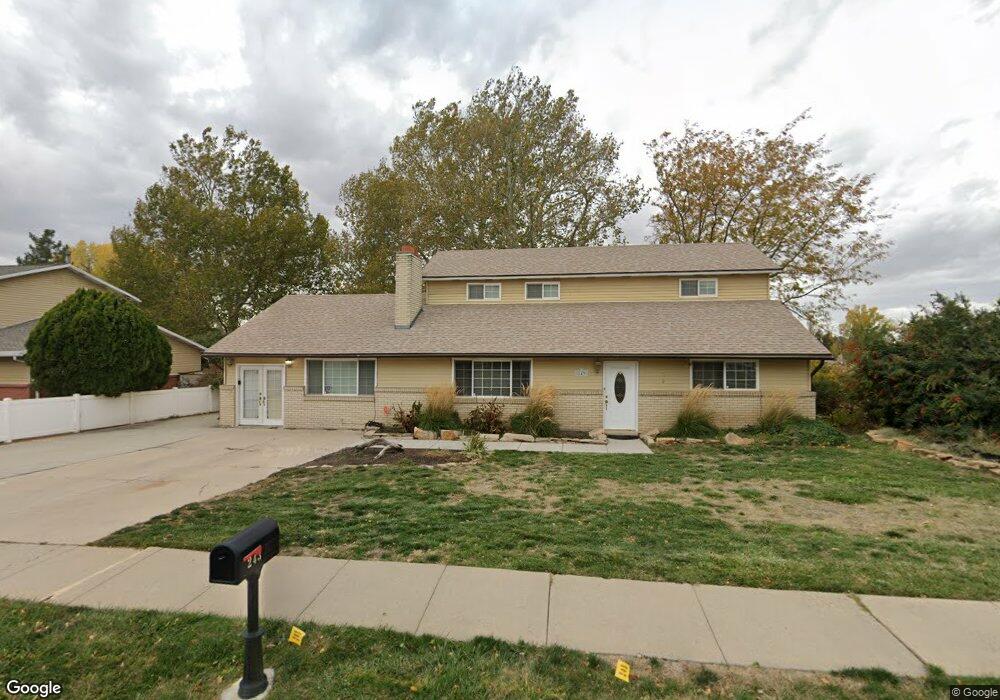
243 N 1000 W West Bountiful, UT 84087
Estimated Value: $586,459 - $900,000
4
Beds
2
Baths
2,370
Sq Ft
$296/Sq Ft
Est. Value
About This Home
This home is located at 243 N 1000 W, West Bountiful, UT 84087 and is currently estimated at $701,865, approximately $296 per square foot. 243 N 1000 W is a home located in Davis County with nearby schools including West Bountiful Elementary School, Bountiful Junior High School, and Viewmont High School.
Ownership History
Date
Name
Owned For
Owner Type
Purchase Details
Closed on
Mar 19, 2014
Sold by
Billings David M and Billings Carma Nelson
Bought by
Holly Refining And Marketing Company Woo
Current Estimated Value
Purchase Details
Closed on
Mar 15, 2005
Sold by
Nelson Carma J and Billings Carma Nelson
Bought by
Billings David M and Billings Carma Nelson
Home Financials for this Owner
Home Financials are based on the most recent Mortgage that was taken out on this home.
Original Mortgage
$123,829
Interest Rate
5.61%
Mortgage Type
New Conventional
Purchase Details
Closed on
Feb 10, 1999
Sold by
Billings David M
Bought by
Billings David M and Nelson Carma J
Home Financials for this Owner
Home Financials are based on the most recent Mortgage that was taken out on this home.
Original Mortgage
$90,000
Interest Rate
6.41%
Create a Home Valuation Report for This Property
The Home Valuation Report is an in-depth analysis detailing your home's value as well as a comparison with similar homes in the area
Home Values in the Area
Average Home Value in this Area
Purchase History
| Date | Buyer | Sale Price | Title Company |
|---|---|---|---|
| Holly Refining And Marketing Company Woo | -- | First American Title | |
| Billings David M | -- | First American Title | |
| Billings David M | -- | Associated Title Company |
Source: Public Records
Mortgage History
| Date | Status | Borrower | Loan Amount |
|---|---|---|---|
| Previous Owner | Billings David M | $123,829 | |
| Previous Owner | Billings David M | $90,000 |
Source: Public Records
Tax History
| Year | Tax Paid | Tax Assessment Tax Assessment Total Assessment is a certain percentage of the fair market value that is determined by local assessors to be the total taxable value of land and additions on the property. | Land | Improvement |
|---|---|---|---|---|
| 2025 | $3,308 | $278,300 | $200,200 | $78,100 |
| 2024 | $3,269 | $284,349 | $166,656 | $117,693 |
| 2023 | $3,134 | $276,100 | $165,583 | $110,517 |
| 2022 | $3,101 | $505,000 | $283,359 | $221,641 |
| 2021 | $2,735 | $374,000 | $233,400 | $140,600 |
| 2020 | $2,428 | $327,000 | $198,219 | $128,781 |
| 2019 | $2,417 | $323,000 | $186,524 | $136,476 |
| 2018 | $2,246 | $295,000 | $167,750 | $127,250 |
| 2016 | $1,924 | $138,050 | $64,720 | $73,330 |
| 2015 | $1,903 | $130,625 | $64,720 | $65,905 |
| 2014 | $1,841 | $130,619 | $65,053 | $65,566 |
| 2013 | -- | $122,918 | $45,032 | $77,886 |
Source: Public Records
Map
Nearby Homes
- 350 N 1100 W
- 1059 W Audrey Ln Unit 10
- 1063 W Audrey Ln Unit 9
- 1067 W Audrey Ln Unit 8
- 1075 W Audrey Ln Unit 6
- 1068 W Audrey Ln Unit 16
- 290 N 500 W Unit 108
- 290 N 500 W Unit 305
- 968 S 970 W
- 449 W 200 N Unit 3
- 401 W 400 N Unit 49
- 758 W 1000 S
- 729 W 925 S
- 403 W 400 N Unit 1
- 1084 W Audrey Ln
- 366 W 1000 N
- 734 W 1300 S Unit W
- 1309 W 1200 S
- 332 N 300 W
- 499 N 200 W Unit 19
Your Personal Tour Guide
Ask me questions while you tour the home.