Estimated Value: $79,000 - $125,000
3
Beds
1
Bath
900
Sq Ft
$115/Sq Ft
Est. Value
About This Home
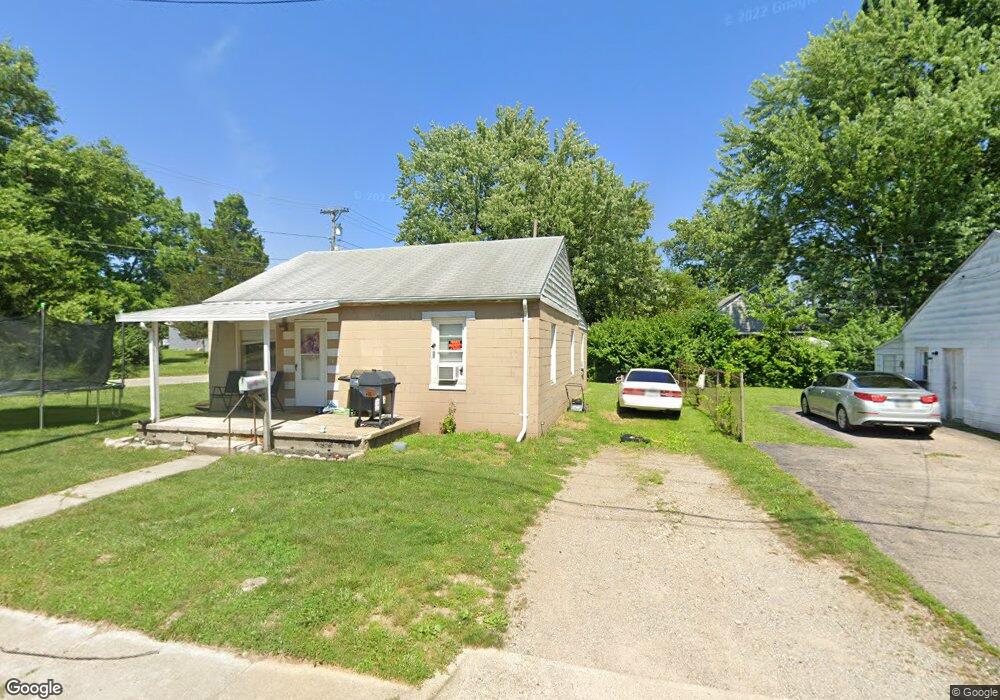
This home is located at 243 N Patton St, Xenia, OH 45385 and is currently estimated at $103,532, approximately $115 per square foot. 243 N Patton St is a home located in Greene County with nearby schools including Xenia High School and Summit Academy Community School for Alternative Learners - Xenia.
Ownership History
Date
Name
Owned For
Owner Type
Purchase Details
Closed on
Oct 14, 2008
Sold by
Jameson Charles E and Jameson Andrea K
Bought by
Gucwa Jody
Current Estimated Value
Purchase Details
Closed on
Sep 1, 1998
Sold by
Julian Investment Group Ii Inc
Bought by
Jameson Charles E and Jameson Andrea K
Home Financials for this Owner
Home Financials are based on the most recent Mortgage that was taken out on this home.
Original Mortgage
$60,076
Interest Rate
7.02%
Purchase Details
Closed on
Jan 28, 1998
Sold by
Julian Investment Group Ii Inc
Bought by
Fitzgerald Mark J
Home Financials for this Owner
Home Financials are based on the most recent Mortgage that was taken out on this home.
Original Mortgage
$36,000
Interest Rate
7.12%
Purchase Details
Closed on
Sep 15, 1997
Sold by
Peterson Marshall E
Bought by
Julian Investment Group Ii
Create a Home Valuation Report for This Property
The Home Valuation Report is an in-depth analysis detailing your home's value as well as a comparison with similar homes in the area
Home Values in the Area
Average Home Value in this Area
Purchase History
| Date | Buyer | Sale Price | Title Company |
|---|---|---|---|
| Gucwa Jody | $14,600 | Attorney | |
| Jameson Charles E | $49,900 | -- | |
| Julian Investment Group Ii Inc | -- | -- | |
| Fitzgerald Mark J | $36,000 | -- | |
| Julian Investment Group Ii | $13,125 | -- |
Source: Public Records
Mortgage History
| Date | Status | Borrower | Loan Amount |
|---|---|---|---|
| Previous Owner | Jameson Charles E | $60,076 | |
| Previous Owner | Fitzgerald Mark J | $36,000 |
Source: Public Records
Tax History Compared to Growth
Tax History
| Year | Tax Paid | Tax Assessment Tax Assessment Total Assessment is a certain percentage of the fair market value that is determined by local assessors to be the total taxable value of land and additions on the property. | Land | Improvement |
|---|---|---|---|---|
| 2024 | $360 | $8,410 | $1,370 | $7,040 |
| 2023 | $360 | $8,410 | $1,370 | $7,040 |
| 2022 | $307 | $6,110 | $1,240 | $4,870 |
| 2021 | $311 | $6,110 | $1,240 | $4,870 |
| 2020 | $298 | $6,110 | $1,240 | $4,870 |
| 2019 | $297 | $5,740 | $1,630 | $4,110 |
| 2018 | $298 | $5,740 | $1,630 | $4,110 |
| 2017 | $290 | $5,740 | $1,630 | $4,110 |
| 2016 | $294 | $5,550 | $1,630 | $3,920 |
| 2015 | $295 | $5,550 | $1,630 | $3,920 |
| 2014 | $282 | $5,550 | $1,630 | $3,920 |
Source: Public Records
Map
Nearby Homes
- 0 N Patton St
- 00 N Patton St
- 1293 E Main St
- 645 E Church St
- 612 E Market St
- 607 E Main St
- 654 E 3rd St
- 541 E Main St
- 568 Louise Dr
- 656 Eden Roc Dr
- 610 Saxony Dr
- 479 N Stadium Dr
- 348 S Stadium Dr
- 508 Marshall Dr
- 513 Redbud Ln
- 119 Park Dr
- 36 Leaman St
- 1311 Eagles Way
- 222 Washington St
- 0 Gultice Rd Unit 940427
- 231 N Patton St
- 1047 Lexington Ave
- 219 N Patton St
- 236 N Patton St
- 999 Lexington Ave
- 228 N Patton St
- 1053 Lexington Ave
- 207 N Patton St
- 1044 Lexington Ave
- 199 N Patton St
- 263 Jefferson St
- 994 Lexington Ave
- 253 Jefferson St
- 253 Jefferson St
- 1020 Lexington Ave
- 279 Jefferson St
- 233 Jefferson St
- 984 Lexington Ave
- 0 Lexington Ave
- 974 Lexington Ave