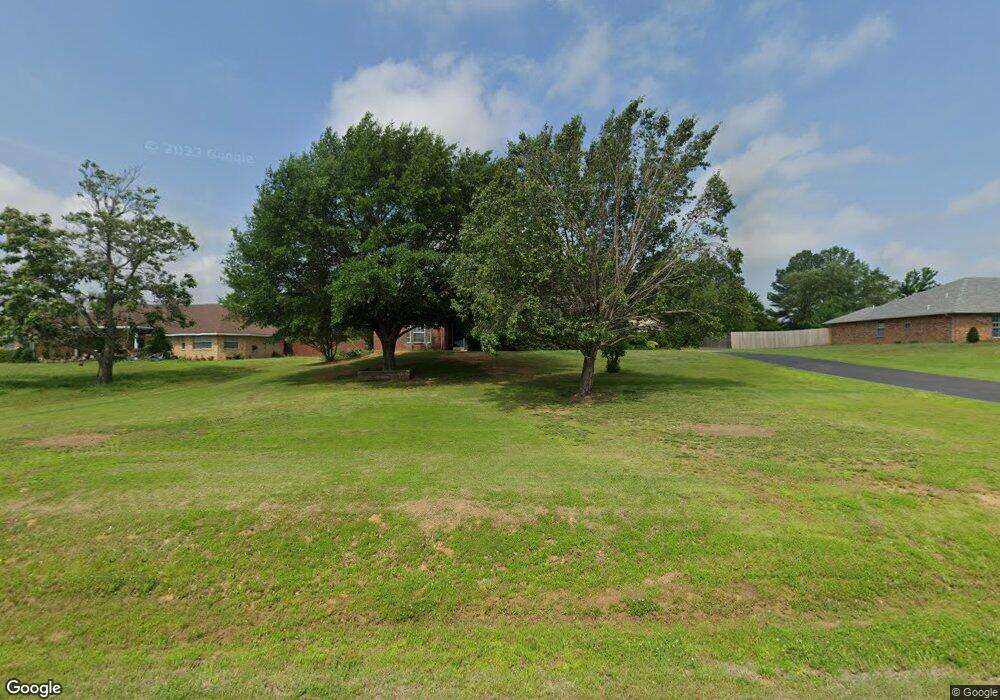
243 Pecan St Durant, OK 74701
Estimated Value: $411,130 - $556,000
3
Beds
3
Baths
3,251
Sq Ft
$150/Sq Ft
Est. Value
About This Home
This home is located at 243 Pecan St, Durant, OK 74701 and is currently estimated at $487,033, approximately $149 per square foot. 243 Pecan St is a home located in Bryan County with nearby schools including Silo Early Childhood Center, Silo Elementary School, and Silo Middle School.
Ownership History
Date
Name
Owned For
Owner Type
Purchase Details
Closed on
Oct 25, 2006
Sold by
Compton Shana and Compton Shana K
Bought by
Willman Scott and Willman Christy
Current Estimated Value
Home Financials for this Owner
Home Financials are based on the most recent Mortgage that was taken out on this home.
Original Mortgage
$42,000
Interest Rate
6.41%
Mortgage Type
Stand Alone Second
Purchase Details
Closed on
Sep 3, 1999
Sold by
Ammons Cleta and Ammons Carroll
Bought by
Compton Jeff and Compton Shana
Purchase Details
Closed on
Jul 24, 1997
Sold by
Hart Earnest and Hart Sheri E
Bought by
Ammons Cleta Jo
Create a Home Valuation Report for This Property
The Home Valuation Report is an in-depth analysis detailing your home's value as well as a comparison with similar homes in the area
Purchase History
| Date | Buyer | Sale Price | Title Company |
|---|---|---|---|
| Willman Scott | $280,000 | None Available | |
| Compton Jeff | $165,000 | -- | |
| Ammons Cleta Jo | -- | -- |
Source: Public Records
Mortgage History
| Date | Status | Borrower | Loan Amount |
|---|---|---|---|
| Closed | Willman Scott | $42,000 |
Source: Public Records
Tax History
| Year | Tax Paid | Tax Assessment Tax Assessment Total Assessment is a certain percentage of the fair market value that is determined by local assessors to be the total taxable value of land and additions on the property. | Land | Improvement |
|---|---|---|---|---|
| 2025 | $3,217 | $38,572 | $3,080 | $35,492 |
| 2024 | $3,164 | $38,391 | $3,080 | $35,311 |
| 2023 | $3,164 | $37,272 | $3,080 | $34,192 |
| 2022 | $3,072 | $37,272 | $3,080 | $34,192 |
| 2021 | $2,955 | $36,776 | $3,032 | $33,744 |
| 2020 | $2,881 | $35,706 | $2,929 | $32,777 |
| 2019 | $2,839 | $34,666 | $2,828 | $31,838 |
| 2018 | $2,765 | $33,656 | $2,716 | $30,940 |
| 2017 | $2,333 | $32,676 | $2,738 | $29,938 |
| 2016 | $2,263 | $31,724 | $2,728 | $28,996 |
| 2015 | $2,194 | $30,800 | $3,300 | $27,500 |
| 2014 | $2,194 | $30,800 | $3,300 | $27,500 |
Source: Public Records
Map
Nearby Homes
- 5616 Stonecreek Dr
- 5110 Valley View Dr
- 1602 Felice Ln
- 2586 Folsom Rd
- 259 Eaglelake Dr
- 5353 Stonebriar Cir
- 377 Mills Dr
- 18 Sandwedge
- 203 Red Oak Dr
- 113 Fairway Dr
- 4001 N Washington Ave
- 106 Santa Monica Ave
- 95 Huntington Beach St
- 0 N Washington Ave
- 20 Blake Ln
- 19 Blake Ln
- 183 Rancho Sol St
- 98 Rancho Sol St
- 134 Rancho Sol St
- 3308 Seabiscuit
Your Personal Tour Guide
Ask me questions while you tour the home.