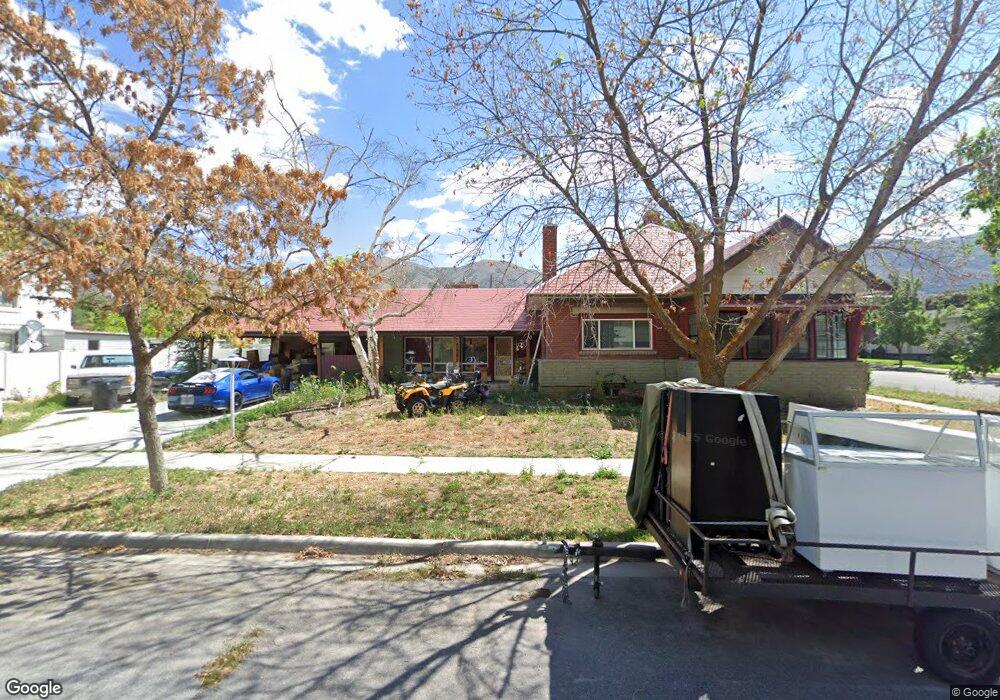
243 S 100 E Brigham City, UT 84302
Estimated Value: $462,000 - $486,620
4
Beds
2
Baths
3,842
Sq Ft
$124/Sq Ft
Est. Value
About This Home
This home is located at 243 S 100 E, Brigham City, UT 84302 and is currently estimated at $477,655, approximately $124 per square foot. 243 S 100 E is a home located in Box Elder County with nearby schools including Golden Spike Elementary, Box Elder Middle School, and Adele C. Young Intermediate School.
Ownership History
Date
Name
Owned For
Owner Type
Purchase Details
Closed on
Feb 10, 2021
Sold by
Vincent Karrie and Vincent 5 Revocable Trust
Bought by
Hoffman Chuck
Current Estimated Value
Home Financials for this Owner
Home Financials are based on the most recent Mortgage that was taken out on this home.
Original Mortgage
$378,784
Outstanding Balance
$338,781
Interest Rate
2.7%
Mortgage Type
VA
Estimated Equity
$138,874
Purchase Details
Closed on
Jan 31, 2019
Sold by
Vincent Karrie
Bought by
Vincent Karrie and Established By A Declaration Of Trust
Purchase Details
Closed on
Mar 14, 2007
Sold by
Johnson Barry
Bought by
Vincet Dennis B and Vincet Karrie
Home Financials for this Owner
Home Financials are based on the most recent Mortgage that was taken out on this home.
Original Mortgage
$140,000
Interest Rate
6.29%
Mortgage Type
New Conventional
Create a Home Valuation Report for This Property
The Home Valuation Report is an in-depth analysis detailing your home's value as well as a comparison with similar homes in the area
Purchase History
| Date | Buyer | Sale Price | Title Company |
|---|---|---|---|
| Hoffman Chuck | -- | American Secure Ttl Brigham | |
| Vincent Karrie | -- | None Available | |
| Vincet Dennis B | -- | Centennial Title Ins Agency |
Source: Public Records
Mortgage History
| Date | Status | Borrower | Loan Amount |
|---|---|---|---|
| Open | Hoffman Chuck | $378,784 | |
| Previous Owner | Vincet Dennis B | $140,000 |
Source: Public Records
Tax History
| Year | Tax Paid | Tax Assessment Tax Assessment Total Assessment is a certain percentage of the fair market value that is determined by local assessors to be the total taxable value of land and additions on the property. | Land | Improvement |
|---|---|---|---|---|
| 2025 | -- | $499,806 | $105,000 | $394,806 |
| 2024 | $2,826 | $902,900 | $100,000 | $802,900 |
| 2023 | $2,826 | $557,072 | $95,000 | $462,072 |
| 2022 | $504 | $266,929 | $22,000 | $244,929 |
| 2021 | $2,225 | $310,944 | $40,000 | $270,944 |
| 2020 | $1,914 | $310,944 | $40,000 | $270,944 |
| 2019 | $1,780 | $153,876 | $22,000 | $131,876 |
| 2018 | $1,590 | $136,674 | $22,000 | $114,674 |
| 2017 | $1,470 | $218,708 | $16,500 | $188,708 |
| 2016 | $1,533 | $115,347 | $16,500 | $98,847 |
| 2015 | $1,409 | $106,361 | $16,500 | $89,861 |
| 2014 | $1,409 | $102,082 | $16,500 | $85,582 |
| 2013 | -- | $102,082 | $16,500 | $85,582 |
Source: Public Records
Map
Nearby Homes
Your Personal Tour Guide
Ask me questions while you tour the home.