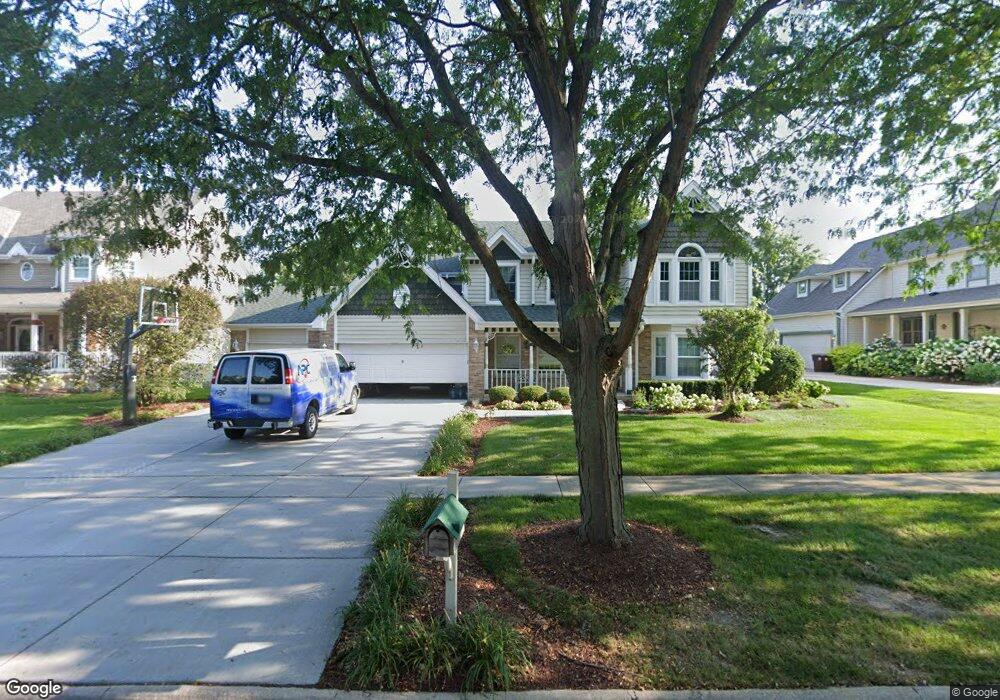
243 Sherlock St Frankfort, IL 60423
North Frankfort NeighborhoodEstimated Value: $686,464 - $740,000
3
Beds
4
Baths
2,746
Sq Ft
$258/Sq Ft
Est. Value
About This Home
This home is located at 243 Sherlock St, Frankfort, IL 60423 and is currently estimated at $709,366, approximately $258 per square foot. 243 Sherlock St is a home located in Will County with nearby schools including Grand Prairie Elementary School, Chelsea Intermediate School, and Hickory Creek Middle School.
Ownership History
Date
Name
Owned For
Owner Type
Purchase Details
Closed on
Jul 30, 2004
Sold by
First National Bank
Bought by
Nelson David M and Nelson Jennifer A
Current Estimated Value
Purchase Details
Closed on
Apr 23, 2002
Sold by
Danley Byron and Danley Judith
Bought by
Greatbanc Trust Company and Trust #8412
Home Financials for this Owner
Home Financials are based on the most recent Mortgage that was taken out on this home.
Original Mortgage
$295,000
Interest Rate
7.13%
Purchase Details
Closed on
Sep 12, 1995
Sold by
Beverly Trust Company
Bought by
Danley Byron and Danley Judith
Home Financials for this Owner
Home Financials are based on the most recent Mortgage that was taken out on this home.
Original Mortgage
$209,600
Interest Rate
8%
Purchase Details
Closed on
May 23, 1995
Sold by
Warfield Jerome and Warfield Sandra
Bought by
Beverly Trust Company
Create a Home Valuation Report for This Property
The Home Valuation Report is an in-depth analysis detailing your home's value as well as a comparison with similar homes in the area
Home Values in the Area
Average Home Value in this Area
Purchase History
| Date | Buyer | Sale Price | Title Company |
|---|---|---|---|
| Nelson David M | -- | Chicago Title Insurance Co | |
| Greatbanc Trust Company | $370,000 | Chicago Title Insurance Co | |
| Danley Byron | $256,000 | Chicago Title Insurance Co | |
| Beverly Trust Company | $60,000 | -- |
Source: Public Records
Mortgage History
| Date | Status | Borrower | Loan Amount |
|---|---|---|---|
| Previous Owner | Greatbanc Trust Company | $295,000 | |
| Previous Owner | Danley Byron | $209,600 |
Source: Public Records
Tax History Compared to Growth
Tax History
| Year | Tax Paid | Tax Assessment Tax Assessment Total Assessment is a certain percentage of the fair market value that is determined by local assessors to be the total taxable value of land and additions on the property. | Land | Improvement |
|---|---|---|---|---|
| 2024 | $16,605 | $217,583 | $42,723 | $174,860 |
| 2023 | $16,605 | $194,323 | $38,156 | $156,167 |
| 2022 | $15,745 | $176,996 | $34,754 | $142,242 |
| 2021 | $13,696 | $165,587 | $32,514 | $133,073 |
| 2020 | $13,361 | $160,921 | $31,598 | $129,323 |
| 2019 | $12,937 | $156,614 | $30,752 | $125,862 |
| 2018 | $12,713 | $152,112 | $29,868 | $122,244 |
| 2017 | $12,708 | $148,562 | $29,171 | $119,391 |
| 2016 | $12,417 | $143,469 | $28,171 | $115,298 |
| 2015 | $11,945 | $138,417 | $27,179 | $111,238 |
| 2014 | $11,945 | $137,455 | $26,990 | $110,465 |
| 2013 | $11,945 | $139,237 | $27,340 | $111,897 |
Source: Public Records
Map
Nearby Homes
- 337 Sherlock St
- 9748 Folkers Dr
- 481 Pleasant Hill Rd
- 9736 Folkers Dr
- 9772 Folkers Dr
- 9724 Folkers Dr
- Lot 3 Town Center Dr
- 119 Pleasant Hill Ct
- 130 Evergreen Dr
- 267 Center Rd
- 701 Brookside Ln
- 425 Cottonwood Rd
- 21160 S 93rd Ave
- 21213 S 93rd Ave
- 21203 S 93rd Ave
- 9378 Fox Run Cir Unit 21B
- 10652 Lexington Ct
- 764 Leslie Ln
- 935 N Butternut Cir
- 9335 Fox Run Cir
- 255 Sherlock St
- 231 Sherlock St
- LOT 5 Sherlock St
- Lot 6 Sherlock St
- 21446 Murphy Cir
- 267 Sherlock St
- 219 Sherlock St
- 21441 Murphy Cir
- lot 16 Murphy Cir
- 254 Sherlock St
- 279 Sherlock St
- 40 N Maple St
- 266 Sherlock St
- 218 Sherlock St
- 9935 Folkers Dr
- 60 N Maple St
- 20 N Maple St
- 278 Sherlock St
- 9885 Folkers Dr
- 70 N Maple St