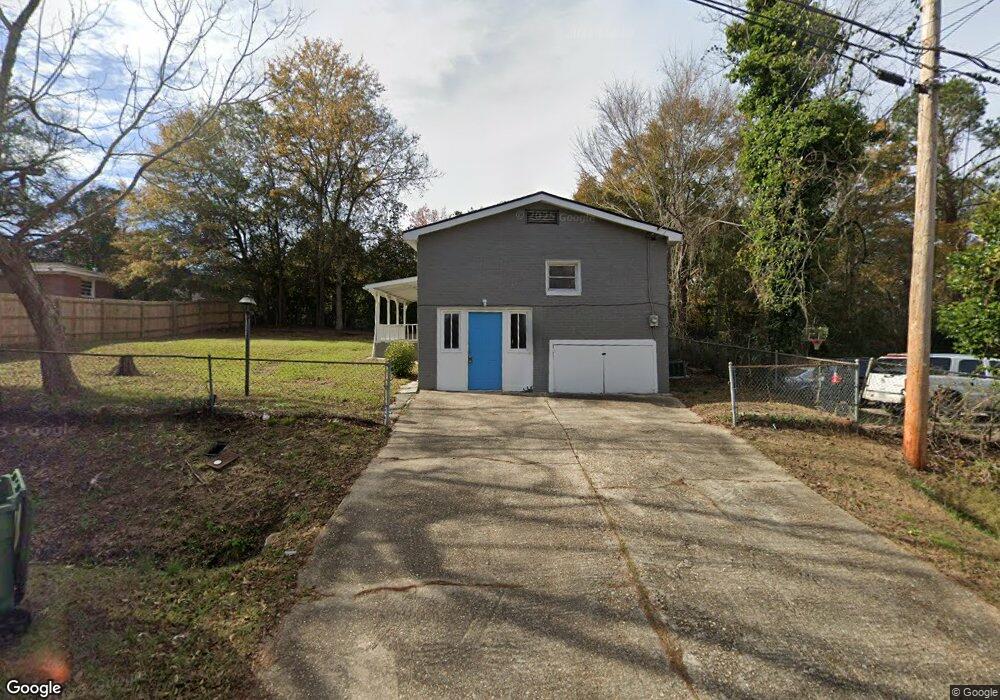
243 Sidney Dr Columbus, GA 31907
East Columbus NeighborhoodEstimated Value: $90,000 - $119,000
3
Beds
1
Bath
861
Sq Ft
$123/Sq Ft
Est. Value
About This Home
This home is located at 243 Sidney Dr, Columbus, GA 31907 and is currently estimated at $105,803, approximately $122 per square foot. 243 Sidney Dr is a home located in Muscogee County with nearby schools including Rothschild Leadership Academy, Kendrick High School, and St. Marys Road Christian Academy.
Ownership History
Date
Name
Owned For
Owner Type
Purchase Details
Closed on
Jan 18, 2024
Sold by
Poole J Patrick
Bought by
Amac Properties Llc
Current Estimated Value
Purchase Details
Closed on
Mar 3, 2022
Sold by
Lani Baker
Bought by
Poole J Patrick
Purchase Details
Closed on
Aug 30, 2019
Sold by
Federal National Mtg Association
Bought by
Baker Lani
Purchase Details
Closed on
Sep 11, 2018
Sold by
Georgia Housing And Finance Authority
Bought by
Federal National Mtg Association
Purchase Details
Closed on
Jul 13, 2018
Sold by
Britt David A
Bought by
Georgia Housing And Finance Authority
Purchase Details
Closed on
Jan 11, 2008
Sold by
Corps Realty Llc
Bought by
Britt Ii David A
Home Financials for this Owner
Home Financials are based on the most recent Mortgage that was taken out on this home.
Original Mortgage
$61,500
Interest Rate
5.85%
Mortgage Type
Purchase Money Mortgage
Create a Home Valuation Report for This Property
The Home Valuation Report is an in-depth analysis detailing your home's value as well as a comparison with similar homes in the area
Home Values in the Area
Average Home Value in this Area
Purchase History
| Date | Buyer | Sale Price | Title Company |
|---|---|---|---|
| Amac Properties Llc | $99,000 | None Listed On Document | |
| Poole J Patrick | $28,500 | Jenkins Arthur Andrew | |
| Poole J Patrick | $28,500 | None Listed On Document | |
| Baker Lani | $11,220 | -- | |
| Federal National Mtg Association | $52,113 | -- | |
| Georgia Housing And Finance Authority | $52,113 | -- | |
| Britt Ii David A | $61,500 | None Available |
Source: Public Records
Mortgage History
| Date | Status | Borrower | Loan Amount |
|---|---|---|---|
| Previous Owner | Britt Ii David A | $61,500 |
Source: Public Records
Tax History
| Year | Tax Paid | Tax Assessment Tax Assessment Total Assessment is a certain percentage of the fair market value that is determined by local assessors to be the total taxable value of land and additions on the property. | Land | Improvement |
|---|---|---|---|---|
| 2025 | $1,525 | $38,952 | $5,792 | $33,160 |
| 2024 | $988 | $25,236 | $5,792 | $19,444 |
| 2023 | $449 | $11,400 | $3,120 | $8,280 |
| 2022 | $583 | $14,288 | $5,792 | $8,496 |
| 2021 | $392 | $9,504 | $5,792 | $3,712 |
| 2020 | $183 | $4,480 | $1,280 | $3,200 |
| 2019 | $816 | $19,912 | $5,792 | $14,120 |
| 2018 | $728 | $17,760 | $5,792 | $11,968 |
| 2017 | $730 | $17,760 | $5,792 | $11,968 |
| 2016 | $449 | $24,148 | $3,732 | $20,416 |
| 2015 | $450 | $24,148 | $3,732 | $20,416 |
| 2014 | $451 | $24,148 | $3,732 | $20,416 |
| 2013 | -- | $24,148 | $3,732 | $20,416 |
Source: Public Records
Map
Nearby Homes
- 410 McCartha Dr
- 4525 Sentry St
- 441 Braselman Ave
- 392 Olsen Ave
- 4422 Pate Dr
- 391 & 401 Victoria Dr
- 4437 St Marys Rd
- 4516 Sims St
- 559 Chandler Dr
- 417 Wickham Dr
- 229 N Oakley Dr
- 4801 Allen St
- 130 Sycamore Ct
- 349 Art Ave
- 3944 Steam Mill Rd
- 643 Southern Pines Dr
- 3823 Ukraine Dr
- 5003 Shirley Ann Dr
- 4930 Capricorn Ct
- 59 Apollo Dr
- 4245 Murrelle St
- 4249 Murrelle St
- 4254 Debby St
- 4248 Debby St
- 4241 Murrelle St
- 248 Sidney Dr
- 4242 Debby St
- 234 Sidney Dr
- 256 Sidney Dr
- 4236 Debby St
- 228 Sidney Dr
- 4252 Murrelle St
- 4244 Murrelle St
- 4260 Murrelle St
- 243 McCartha Dr
- 4229 Murrelle St
- 4240 Murrelle St
- 237 McCartha Dr
- 4253 Debby St
- 4249 Debby St Unit B
Your Personal Tour Guide
Ask me questions while you tour the home.