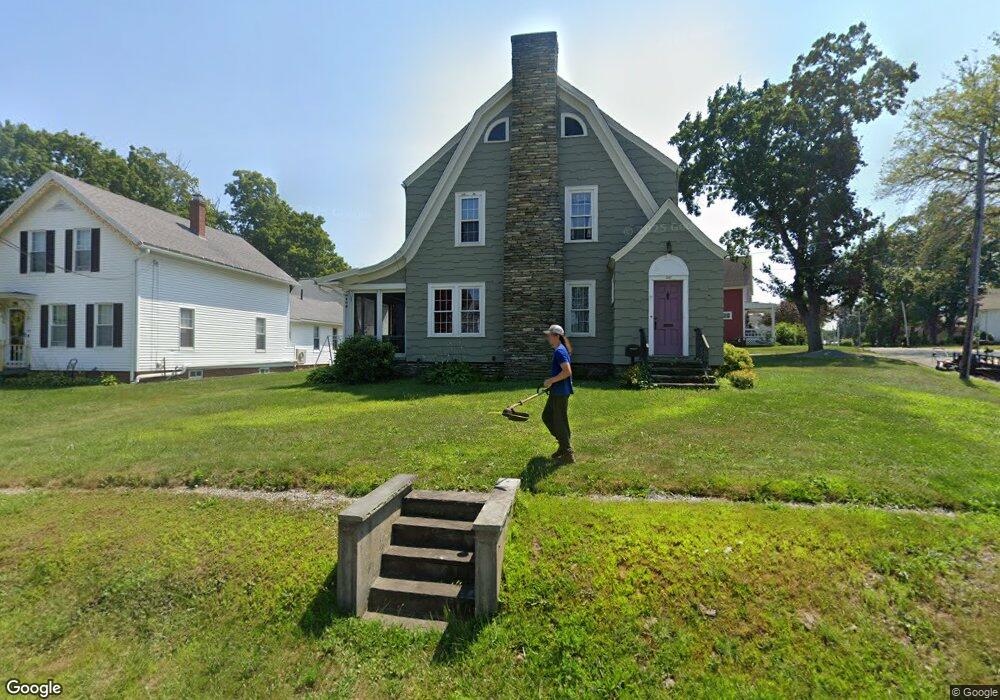
243 South St Unit 1 Southbridge, MA 01550
Estimated Value: $323,000 - $390,000
3
Beds
2
Baths
1,500
Sq Ft
$236/Sq Ft
Est. Value
About This Home
This home is located at 243 South St Unit 1, Southbridge, MA 01550 and is currently estimated at $354,496, approximately $236 per square foot. 243 South St Unit 1 is a home located in Worcester County with nearby schools including Trinity Catholic Academy and ViewPoint Christian Academy.
Ownership History
Date
Name
Owned For
Owner Type
Purchase Details
Closed on
May 28, 2004
Sold by
Hatala Mary Ann
Bought by
Chinnock Randal B
Current Estimated Value
Purchase Details
Closed on
Nov 13, 1998
Sold by
Totolos Ann
Bought by
Hatala Mary Ann
Create a Home Valuation Report for This Property
The Home Valuation Report is an in-depth analysis detailing your home's value as well as a comparison with similar homes in the area
Home Values in the Area
Average Home Value in this Area
Purchase History
| Date | Buyer | Sale Price | Title Company |
|---|---|---|---|
| Chinnock Randal B | $183,500 | -- | |
| Chinnock Randal B | $183,500 | -- | |
| Hatala Mary Ann | $105,000 | -- | |
| Hatala Mary Ann | $105,000 | -- |
Source: Public Records
Mortgage History
| Date | Status | Borrower | Loan Amount |
|---|---|---|---|
| Open | Hatala Mary Ann | $115,000 |
Source: Public Records
Tax History Compared to Growth
Tax History
| Year | Tax Paid | Tax Assessment Tax Assessment Total Assessment is a certain percentage of the fair market value that is determined by local assessors to be the total taxable value of land and additions on the property. | Land | Improvement |
|---|---|---|---|---|
| 2025 | $4,624 | $315,400 | $37,700 | $277,700 |
| 2024 | $4,952 | $324,500 | $31,400 | $293,100 |
| 2023 | $4,646 | $293,300 | $31,400 | $261,900 |
| 2022 | $4,405 | $246,100 | $26,800 | $219,300 |
| 2021 | $4,306 | $221,500 | $26,800 | $194,700 |
| 2020 | $3,740 | $192,000 | $26,800 | $165,200 |
| 2018 | $3,575 | $172,300 | $26,800 | $145,500 |
| 2017 | $3,341 | $162,400 | $26,800 | $135,600 |
| 2016 | $3,282 | $162,400 | $26,800 | $135,600 |
| 2015 | $3,186 | $156,500 | $26,800 | $129,700 |
| 2014 | $2,960 | $150,700 | $26,800 | $123,900 |
Source: Public Records
Map
Nearby Homes