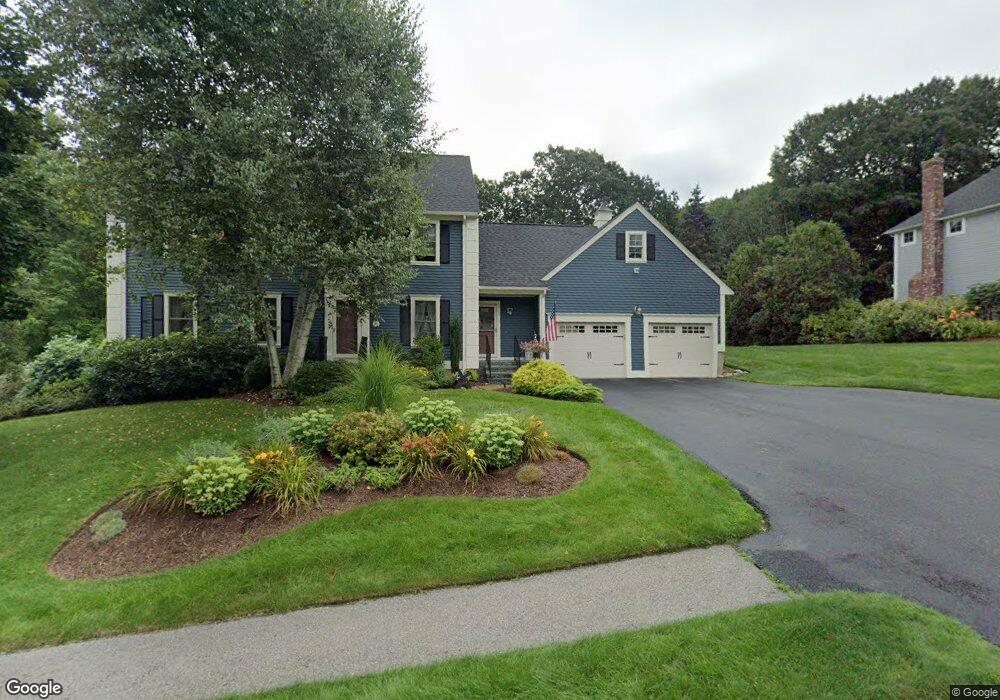
243 Sycamore Dr Holden, MA 01520
Estimated Value: $661,000 - $901,000
4
Beds
3
Baths
2,136
Sq Ft
$355/Sq Ft
Est. Value
About This Home
This home is located at 243 Sycamore Dr, Holden, MA 01520 and is currently estimated at $758,250, approximately $354 per square foot. 243 Sycamore Dr is a home located in Worcester County with nearby schools including Wachusett Regional High School, Holden Christian Academy, and Notre Dame Academy.
Ownership History
Date
Name
Owned For
Owner Type
Purchase Details
Closed on
Apr 2, 2024
Sold by
Brosnihan George T and Brosnihan Gail A
Bought by
Brosnihan
Current Estimated Value
Purchase Details
Closed on
Sep 8, 1994
Sold by
Stately Homes Inc
Bought by
Brosnihan George T and Brosnihan Gail A
Home Financials for this Owner
Home Financials are based on the most recent Mortgage that was taken out on this home.
Original Mortgage
$45,000
Interest Rate
8.54%
Mortgage Type
Purchase Money Mortgage
Create a Home Valuation Report for This Property
The Home Valuation Report is an in-depth analysis detailing your home's value as well as a comparison with similar homes in the area
Home Values in the Area
Average Home Value in this Area
Purchase History
| Date | Buyer | Sale Price | Title Company |
|---|---|---|---|
| Brosnihan | -- | None Available | |
| Brosnihan George T | $217,110 | -- |
Source: Public Records
Mortgage History
| Date | Status | Borrower | Loan Amount |
|---|---|---|---|
| Previous Owner | Brosnihan George T | $50,000 | |
| Previous Owner | Brosnihan George T | $45,000 |
Source: Public Records
Tax History
| Year | Tax Paid | Tax Assessment Tax Assessment Total Assessment is a certain percentage of the fair market value that is determined by local assessors to be the total taxable value of land and additions on the property. | Land | Improvement |
|---|---|---|---|---|
| 2025 | $8,790 | $634,200 | $225,800 | $408,400 |
| 2024 | $8,135 | $574,900 | $198,700 | $376,200 |
| 2023 | $7,706 | $514,100 | $172,700 | $341,400 |
| 2022 | $7,315 | $441,700 | $139,600 | $302,100 |
| 2021 | $7,465 | $429,000 | $137,300 | $291,700 |
| 2020 | $7,230 | $425,300 | $130,800 | $294,500 |
| 2019 | $7,111 | $407,500 | $130,800 | $276,700 |
| 2018 | $6,838 | $388,300 | $124,500 | $263,800 |
| 2017 | $6,647 | $377,900 | $128,500 | $249,400 |
| 2016 | $6,210 | $360,000 | $122,300 | $237,700 |
| 2015 | $6,311 | $348,300 | $122,300 | $226,000 |
| 2014 | $6,182 | $348,300 | $122,300 | $226,000 |
Source: Public Records
Map
Nearby Homes
- 0 Chapin Rd
- 168 Twinbrooke Dr
- 527 Salisbury St
- 131 Twinbrooke Dr
- 289 Bailey Rd
- 47 Harvest Cir
- 576 Reservoir St
- 216 Reservoir St Unit 107
- 216 Reservoir St Unit 208
- 216 Reservoir St Unit 202
- 218 Reservoir St Unit 326
- 288 Fisher Rd
- 23 Gail Dr
- 8 (Lot 1) Holmes Dr
- 26 Avery Heights Dr
- 4004 Brompton Cir
- 770 Salisbury St Unit 333
- 158 Chester St
- 1 Baiting Brook Ln Unit 50
- 63 Walnut St
- 235 Sycamore Dr
- 255 Sycamore Dr
- 242 Sycamore Dr
- 225 Sycamore Dr
- 252 Sycamore Dr
- 236 Sycamore Dr
- 260 Sycamore Dr
- 15 Cypress Cir
- 7 Cypress Cir
- 232 Sycamore Dr
- 217 Sycamore Dr
- 224 Sycamore Dr
- 274 Sycamore Dr
- 185 Fox Hill Dr
- 16 Cypress Cir
- 8 Cypress Cir
- 205 Sycamore Dr
- 151 Sycamore Dr
- 216 Sycamore Dr
- 177 Fox Hill Dr
Your Personal Tour Guide
Ask me questions while you tour the home.