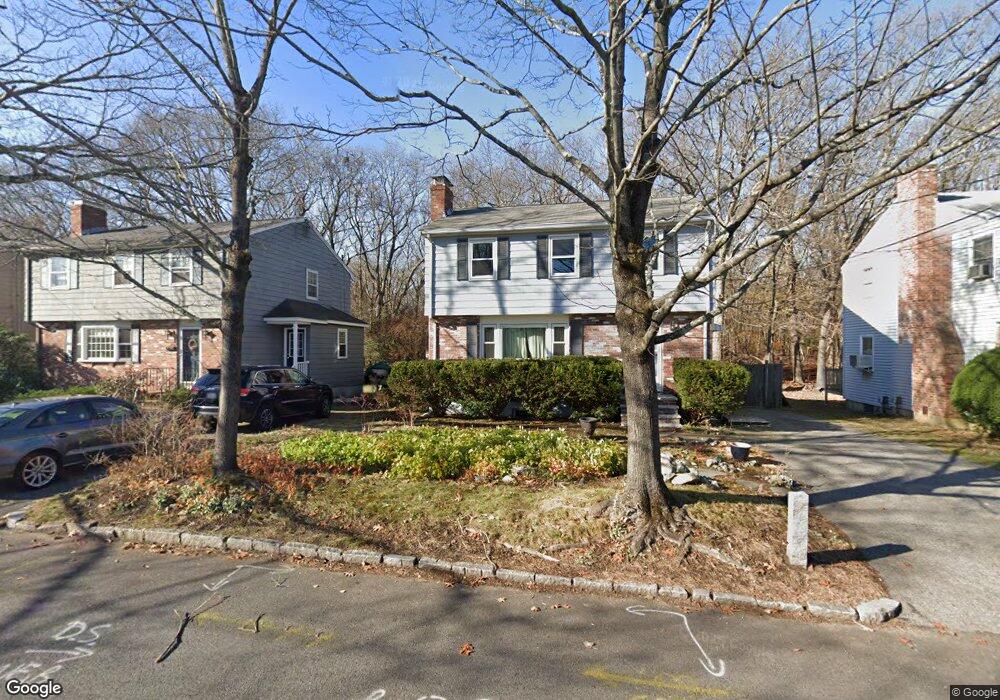
243 Sylvia St Arlington, MA 02476
Arlington Heights NeighborhoodEstimated Value: $1,003,910 - $1,213,000
3
Beds
2
Baths
1,708
Sq Ft
$650/Sq Ft
Est. Value
About This Home
This home is located at 243 Sylvia St, Arlington, MA 02476 and is currently estimated at $1,110,478, approximately $650 per square foot. 243 Sylvia St is a home located in Middlesex County with nearby schools including Dallin Elementary School, Ottoson Middle School, and Arlington High School.
Ownership History
Date
Name
Owned For
Owner Type
Purchase Details
Closed on
Jan 31, 2000
Sold by
Quinzani Joan K
Bought by
Blum Kenneth I and Leven Julie F
Current Estimated Value
Home Financials for this Owner
Home Financials are based on the most recent Mortgage that was taken out on this home.
Original Mortgage
$239,000
Interest Rate
7.83%
Mortgage Type
Purchase Money Mortgage
Create a Home Valuation Report for This Property
The Home Valuation Report is an in-depth analysis detailing your home's value as well as a comparison with similar homes in the area
Home Values in the Area
Average Home Value in this Area
Purchase History
| Date | Buyer | Sale Price | Title Company |
|---|---|---|---|
| Blum Kenneth I | $336,500 | -- |
Source: Public Records
Mortgage History
| Date | Status | Borrower | Loan Amount |
|---|---|---|---|
| Open | Blum Kenneth I | $205,000 | |
| Closed | Blum Kenneth I | $239,000 | |
| Previous Owner | Blum Kenneth I | $80,000 |
Source: Public Records
Tax History
| Year | Tax Paid | Tax Assessment Tax Assessment Total Assessment is a certain percentage of the fair market value that is determined by local assessors to be the total taxable value of land and additions on the property. | Land | Improvement |
|---|---|---|---|---|
| 2025 | $9,429 | $875,500 | $444,000 | $431,500 |
| 2024 | $8,784 | $829,500 | $427,300 | $402,200 |
| 2023 | $8,597 | $766,900 | $399,600 | $367,300 |
| 2022 | $8,372 | $733,100 | $388,500 | $344,600 |
| 2021 | $8,207 | $723,700 | $388,500 | $335,200 |
| 2020 | $8,004 | $723,700 | $388,500 | $335,200 |
| 2019 | $7,251 | $644,000 | $383,000 | $261,000 |
| 2018 | $6,733 | $555,100 | $294,100 | $261,000 |
| 2017 | $6,764 | $538,500 | $277,500 | $261,000 |
| 2016 | $6,609 | $516,300 | $255,300 | $261,000 |
| 2015 | $6,688 | $493,600 | $238,700 | $254,900 |
Source: Public Records
Map
Nearby Homes
Your Personal Tour Guide
Ask me questions while you tour the home.