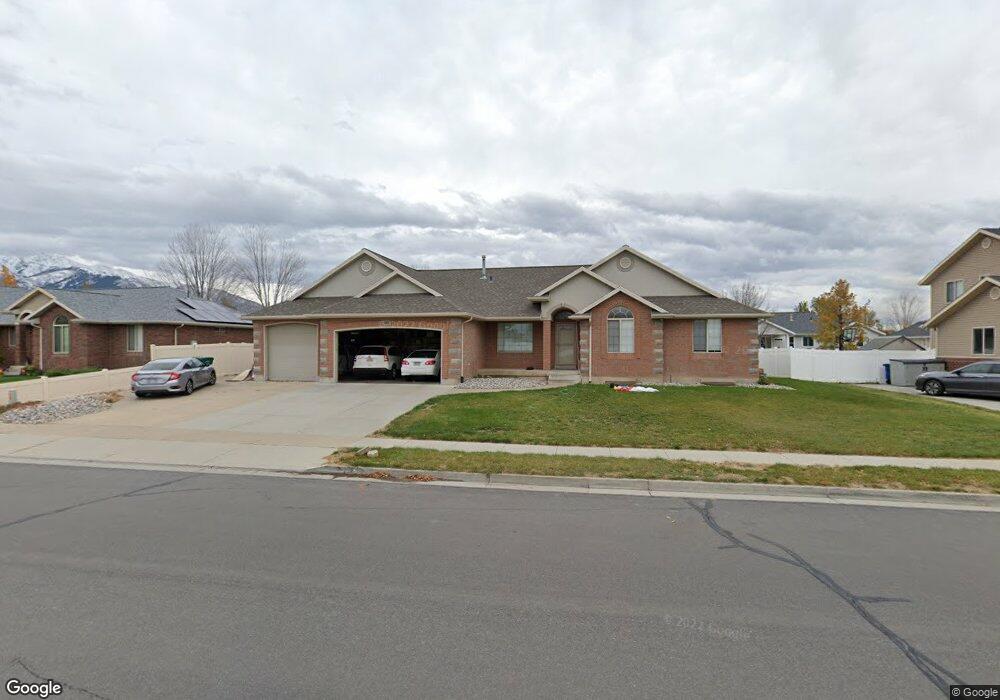
243 W 700 S Layton, UT 84041
Estimated Value: $514,000 - $658,000
4
Beds
2
Baths
1,732
Sq Ft
$354/Sq Ft
Est. Value
About This Home
This home is located at 243 W 700 S, Layton, UT 84041 and is currently estimated at $613,611, approximately $354 per square foot. 243 W 700 S is a home located in Davis County with nearby schools including Layton Elementary School, Fairfield Junior High School, and Davis High School.
Ownership History
Date
Name
Owned For
Owner Type
Purchase Details
Closed on
Apr 12, 2023
Sold by
Casper Merleen G and Casper Diana G
Bought by
Merleen G Casper Living Trust and Casper
Current Estimated Value
Purchase Details
Closed on
May 27, 2020
Sold by
Casper Merleen G and Leavitt Norleen G
Bought by
Casper Marleen G and Casper Diana G
Purchase Details
Closed on
Aug 27, 2003
Sold by
Nelson Zachary
Bought by
Casper Merleen G and Leavitt Norleen G
Purchase Details
Closed on
Jul 9, 2002
Sold by
L Dale Green Construction Inc
Bought by
Nelson Zachary
Home Financials for this Owner
Home Financials are based on the most recent Mortgage that was taken out on this home.
Original Mortgage
$176,000
Interest Rate
6.71%
Create a Home Valuation Report for This Property
The Home Valuation Report is an in-depth analysis detailing your home's value as well as a comparison with similar homes in the area
Home Values in the Area
Average Home Value in this Area
Purchase History
| Date | Buyer | Sale Price | Title Company |
|---|---|---|---|
| Merleen G Casper Living Trust | -- | None Listed On Document | |
| Casper Marleen G | -- | None Available | |
| Casper Merleen G | -- | Inwest Title Services Inc | |
| Nelson Zachary | -- | Security Title Company |
Source: Public Records
Mortgage History
| Date | Status | Borrower | Loan Amount |
|---|---|---|---|
| Previous Owner | Nelson Zachary | $176,000 | |
| Closed | Nelson Zachary | $22,000 |
Source: Public Records
Tax History Compared to Growth
Tax History
| Year | Tax Paid | Tax Assessment Tax Assessment Total Assessment is a certain percentage of the fair market value that is determined by local assessors to be the total taxable value of land and additions on the property. | Land | Improvement |
|---|---|---|---|---|
| 2025 | $3,055 | $320,650 | $123,902 | $196,748 |
| 2024 | $2,866 | $303,050 | $134,239 | $168,811 |
| 2023 | $2,887 | $538,000 | $138,534 | $399,466 |
| 2022 | $3,152 | $319,000 | $82,795 | $236,205 |
| 2021 | $2,710 | $409,000 | $124,191 | $284,809 |
| 2020 | $2,465 | $357,000 | $105,497 | $251,503 |
| 2019 | $2,397 | $340,000 | $105,815 | $234,185 |
| 2018 | $2,219 | $316,000 | $93,075 | $222,925 |
| 2016 | $2,368 | $173,910 | $39,081 | $134,829 |
| 2015 | $2,354 | $164,175 | $39,081 | $125,094 |
| 2014 | $2,444 | $174,242 | $39,081 | $135,161 |
| 2013 | -- | $145,462 | $37,058 | $108,404 |
Source: Public Records
Map
Nearby Homes
- 774 W Farming Way
- 562 S 850 W
- 267 S Melody St
- 268 E 900 S
- 282 E 925 S
- 174 W Dawson St
- 1038 S Old Towne Rd
- 256 Seemore Dr
- 1042 W Shoreline Dr
- 362 S 950 W
- 296 S 950 W
- 1429 W Lincoln Way
- Creighton Farmhouse Plan at Angel Hill
- 355 W Gentile St
- 557 S Angel St
- 356 W 25 N
- 71 S Harvs Ln
- 473 E Alice Way
- 493 E Alice Way
- 485 W 100 N