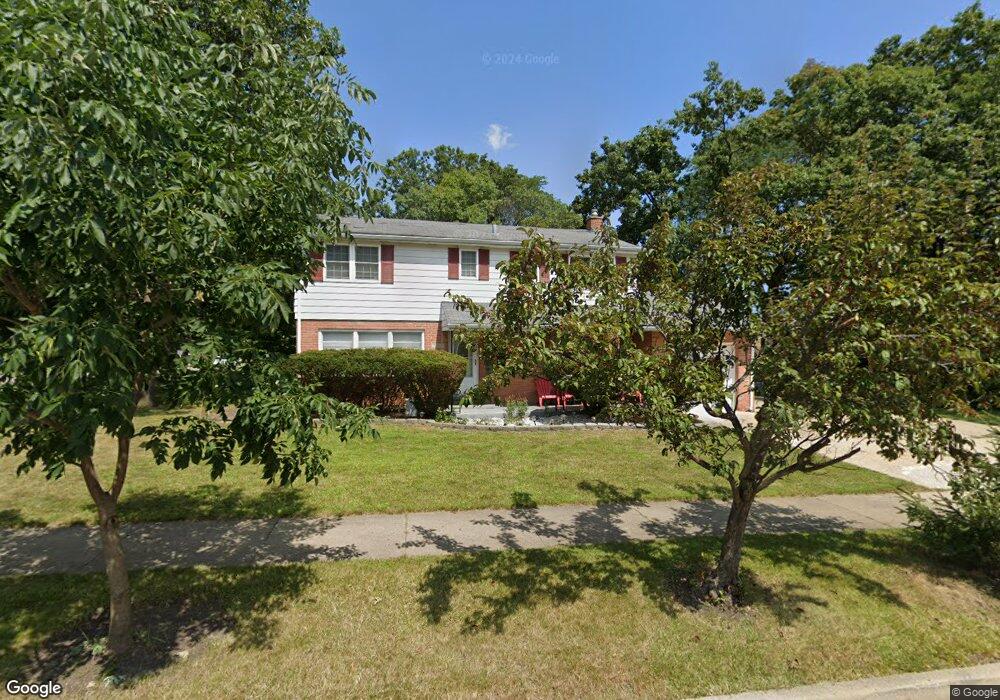
2430 Brookside Ave Waukegan, IL 60085
West Waukegan NeighborhoodEstimated Value: $280,000 - $308,282
4
Beds
3
Baths
1,800
Sq Ft
$165/Sq Ft
Est. Value
About This Home
This home is located at 2430 Brookside Ave, Waukegan, IL 60085 and is currently estimated at $297,321, approximately $165 per square foot. 2430 Brookside Ave is a home located in Lake County with nearby schools including Whittier Elementary School, Robert E. Abbott Middle School, and Waukegan High School.
Ownership History
Date
Name
Owned For
Owner Type
Purchase Details
Closed on
Dec 17, 2004
Sold by
Najarro Paul W and Najarro Miriam
Bought by
Osorio Marco A and Romero Merlin
Current Estimated Value
Home Financials for this Owner
Home Financials are based on the most recent Mortgage that was taken out on this home.
Original Mortgage
$173,548
Outstanding Balance
$87,433
Interest Rate
5.82%
Mortgage Type
FHA
Estimated Equity
$209,888
Purchase Details
Closed on
Feb 25, 2002
Sold by
The Chase Manhattan Bank
Bought by
Najarro Paul and Najarro Rosa Miriam
Purchase Details
Closed on
Sep 20, 2001
Sold by
Fernandez
Bought by
Chase Manhattan Bank and Credit Based Asset Servicing & Securitiz
Purchase Details
Closed on
May 19, 1994
Sold by
Crabtree Peter M and Crabtree Jana M
Bought by
Fernandes William
Home Financials for this Owner
Home Financials are based on the most recent Mortgage that was taken out on this home.
Original Mortgage
$88,200
Interest Rate
8.5%
Create a Home Valuation Report for This Property
The Home Valuation Report is an in-depth analysis detailing your home's value as well as a comparison with similar homes in the area
Home Values in the Area
Average Home Value in this Area
Purchase History
| Date | Buyer | Sale Price | Title Company |
|---|---|---|---|
| Osorio Marco A | $176,000 | -- | |
| Najarro Paul | $130,000 | First American Title | |
| Chase Manhattan Bank | -- | Wheatland Title | |
| Fernandes William | $126,000 | Chicago Title Insurance Co |
Source: Public Records
Mortgage History
| Date | Status | Borrower | Loan Amount |
|---|---|---|---|
| Open | Osorio Marco A | $173,548 | |
| Previous Owner | Fernandes William | $88,200 |
Source: Public Records
Tax History Compared to Growth
Tax History
| Year | Tax Paid | Tax Assessment Tax Assessment Total Assessment is a certain percentage of the fair market value that is determined by local assessors to be the total taxable value of land and additions on the property. | Land | Improvement |
|---|---|---|---|---|
| 2024 | $6,729 | $88,643 | $15,263 | $73,380 |
| 2023 | $6,372 | $79,363 | $13,666 | $65,697 |
| 2022 | $6,372 | $71,184 | $11,627 | $59,557 |
| 2021 | $6,422 | $67,599 | $10,757 | $56,842 |
| 2020 | $6,459 | $62,976 | $10,021 | $52,955 |
| 2019 | $6,447 | $57,708 | $9,183 | $48,525 |
| 2018 | $5,588 | $49,600 | $11,816 | $37,784 |
| 2017 | $5,389 | $43,882 | $10,454 | $33,428 |
| 2016 | $4,965 | $38,132 | $9,084 | $29,048 |
| 2015 | $4,751 | $34,128 | $8,130 | $25,998 |
| 2014 | $4,402 | $31,558 | $8,500 | $23,058 |
| 2012 | $5,676 | $34,189 | $9,208 | $24,981 |
Source: Public Records
Map
Nearby Homes
- 0 Brookside Ave
- 2115 Lydia St
- 24 Washington Terrace
- 615 Tiffany Dr
- 102 Baldwin Ave
- 1213 Grand Ave
- 132 Dorchester Ct
- 49 S Lewis Ave
- 621 N Austin Ave
- 3170 W Monroe St Unit 309
- 34887 N Austin Ave
- 603 N Austin Ave
- 1005 N Lewis Ave
- 2726 W Hidden Glen Dr
- 1416 Hamilton Ct
- 12698 W Grandview Ave
- 12601 W Atlantic Ave
- 2116 & 2101 Williamsburg Dr
- 12716 W Grandview Ave
- 1023 N Elmwood Ave
- 335 N Mcaree Rd
- 339 N Mcaree Rd
- 2420 Brookside Ave
- 332 Flossmoor Ave
- 330 N Mcaree Rd
- 403 N Mcaree Rd
- 400 N Mcaree Rd
- 402 Flossmoor Ave
- 2604 Brookside Ave
- 408 N Mcaree Rd
- 406 Flossmoor Ave
- 2608 Brookside Ave
- 335 Flossmoor Ave
- 2400 Brookside Ave
- 411 N Mcaree Rd
- 339 Flossmoor Ave
- 401 Campus Cir
- 410 Flossmoor Ave
- 403 Flossmoor Ave