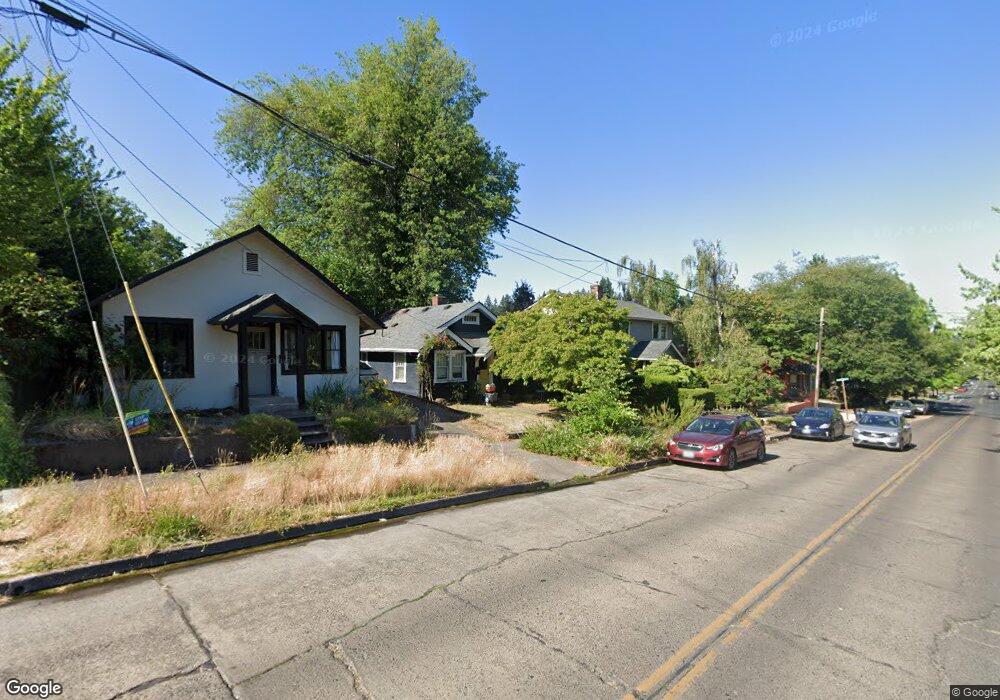
2430 Cherry Grove St Eugene, OR 97403
Fairmount NeighborhoodEstimated Value: $366,050 - $405,000
2
Beds
1
Bath
640
Sq Ft
$596/Sq Ft
Est. Value
About This Home
This home is located at 2430 Cherry Grove St, Eugene, OR 97403 and is currently estimated at $381,263, approximately $595 per square foot. 2430 Cherry Grove St is a home located in Lane County with nearby schools including Edison Elementary School, Roosevelt Middle School, and South Eugene High School.
Ownership History
Date
Name
Owned For
Owner Type
Purchase Details
Closed on
Dec 28, 2004
Sold by
Benson William H and Benson Traci A
Bought by
Stawarska Beata
Current Estimated Value
Home Financials for this Owner
Home Financials are based on the most recent Mortgage that was taken out on this home.
Original Mortgage
$135,200
Outstanding Balance
$67,289
Interest Rate
5.74%
Mortgage Type
Purchase Money Mortgage
Estimated Equity
$313,974
Purchase Details
Closed on
May 14, 2004
Sold by
Reaves Michael E
Bought by
Benson William H and Benson Traci A
Home Financials for this Owner
Home Financials are based on the most recent Mortgage that was taken out on this home.
Original Mortgage
$123,500
Interest Rate
5.77%
Mortgage Type
Purchase Money Mortgage
Purchase Details
Closed on
Feb 1, 1999
Sold by
Reaves Janet L
Bought by
Reaves Michael E
Create a Home Valuation Report for This Property
The Home Valuation Report is an in-depth analysis detailing your home's value as well as a comparison with similar homes in the area
Home Values in the Area
Average Home Value in this Area
Purchase History
| Date | Buyer | Sale Price | Title Company |
|---|---|---|---|
| Stawarska Beata | $169,000 | Cascade Title Co | |
| Benson William H | $123,500 | Cascade Title Co | |
| Reaves Michael E | -- | Key Title Company |
Source: Public Records
Mortgage History
| Date | Status | Borrower | Loan Amount |
|---|---|---|---|
| Open | Stawarska Beata | $135,200 | |
| Previous Owner | Benson William H | $123,500 | |
| Closed | Stawarska Beata | $25,350 |
Source: Public Records
Tax History
| Year | Tax Paid | Tax Assessment Tax Assessment Total Assessment is a certain percentage of the fair market value that is determined by local assessors to be the total taxable value of land and additions on the property. | Land | Improvement |
|---|---|---|---|---|
| 2025 | $2,774 | $142,365 | -- | -- |
| 2024 | $2,739 | $138,219 | -- | -- |
| 2023 | $2,739 | $134,194 | $0 | $0 |
| 2022 | $2,566 | $130,286 | $0 | $0 |
| 2021 | $2,410 | $126,492 | $0 | $0 |
| 2020 | $2,419 | $122,808 | $0 | $0 |
| 2019 | $2,336 | $119,232 | $0 | $0 |
| 2018 | $2,199 | $112,388 | $0 | $0 |
| 2017 | $2,101 | $112,388 | $0 | $0 |
| 2016 | $2,048 | $109,115 | $0 | $0 |
| 2015 | $1,990 | $105,937 | $0 | $0 |
| 2014 | $1,949 | $102,851 | $0 | $0 |
Source: Public Records
Map
Nearby Homes
- 2642 Central Blvd
- 0 Agate St
- 2610 Elinor St
- 2042 Onyx St
- 2683 Cresta de Ruta St
- 2825 2819 Capital Dr Unit 18, 19
- 0 Capital Dr
- 2993 Capital Dr Unit 1
- 2985 Capital Dr Unit 3
- 2694 Cupola Dr Unit 21
- 2693 Cupola Dr
- 2620 Cupola Dr Unit 27
- 2662 Cupola Dr Unit 31
- 2639 Cupola Dr Unit 12
- 2627 Cupola Dr Unit 9
- 2629 Cupola Dr Unit 10
- 2645 Cupola Dr Unit 13
- 275 Sunset Dr
- 2707 Hilyard St
- 2749 Hilyard St
- 2420 Cherry Grove St
- 2445 Agate St
- 2457 Agate St
- 1670 E 24th Aly
- 1628 E 24th Ave
- 1636 E 24th Ave
- 2410 Cherry Grove St
- 1648 E 24th Ave
- 2431 Cherry Grove St
- 2425 Cherry Grove St
- 1649 E 25th Ave
- 2427 Agate St
- 1658 E 24th Ave
- 2463 Agate St
- 2417 Agate St
- 1668 E 24th Ave
- 1651 E 25th Ave
- 2491 Agate St
- 1677 E 25th Ave
- 1676 E 24th Ave
Your Personal Tour Guide
Ask me questions while you tour the home.