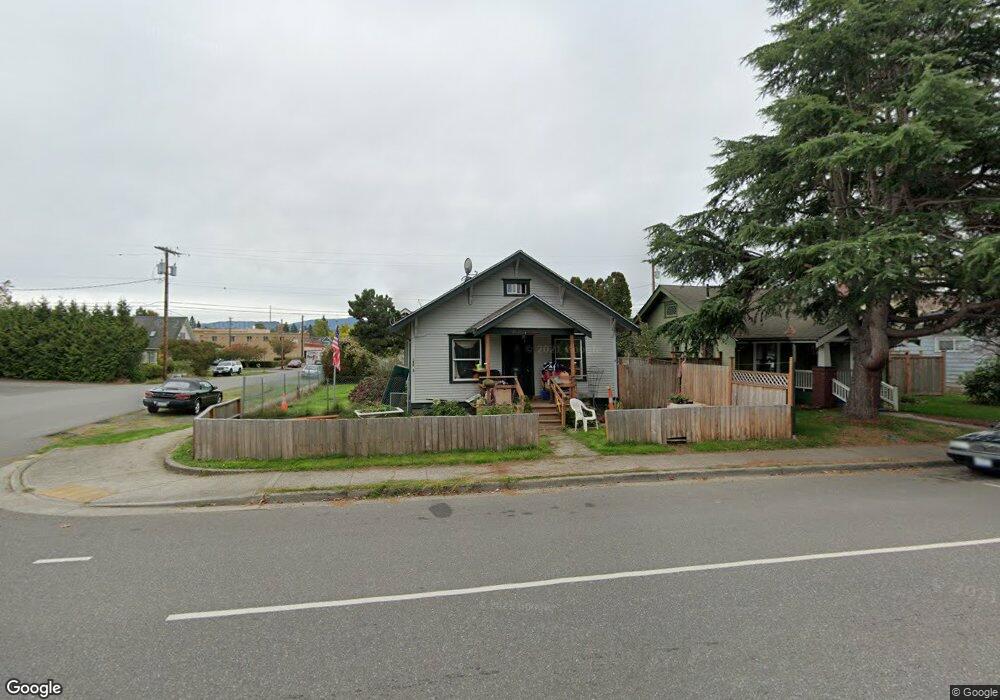
2430 Elm St Bellingham, WA 98225
Columbia NeighborhoodEstimated Value: $527,485 - $577,000
2
Beds
2
Baths
929
Sq Ft
$591/Sq Ft
Est. Value
About This Home
This home is located at 2430 Elm St, Bellingham, WA 98225 and is currently estimated at $549,121, approximately $591 per square foot. 2430 Elm St is a home located in Whatcom County with nearby schools including Columbia Elementary School, Whatcom Middle School, and Bellingham High School.
Ownership History
Date
Name
Owned For
Owner Type
Purchase Details
Closed on
Aug 15, 2005
Sold by
Niblock Laurel
Bought by
Wilks Dennis R
Current Estimated Value
Home Financials for this Owner
Home Financials are based on the most recent Mortgage that was taken out on this home.
Original Mortgage
$68,000
Outstanding Balance
$35,491
Interest Rate
5.56%
Mortgage Type
Fannie Mae Freddie Mac
Estimated Equity
$513,630
Purchase Details
Closed on
Nov 19, 2002
Sold by
Evans Caryn L
Bought by
Niblock Laurel
Home Financials for this Owner
Home Financials are based on the most recent Mortgage that was taken out on this home.
Original Mortgage
$130,000
Interest Rate
5.89%
Mortgage Type
Seller Take Back
Create a Home Valuation Report for This Property
The Home Valuation Report is an in-depth analysis detailing your home's value as well as a comparison with similar homes in the area
Home Values in the Area
Average Home Value in this Area
Purchase History
| Date | Buyer | Sale Price | Title Company |
|---|---|---|---|
| Wilks Dennis R | $209,280 | Chicago Title Insurance | |
| Niblock Laurel | $135,000 | Chicago Title Insurance |
Source: Public Records
Mortgage History
| Date | Status | Borrower | Loan Amount |
|---|---|---|---|
| Open | Wilks Dennis R | $68,000 | |
| Previous Owner | Niblock Laurel | $130,000 |
Source: Public Records
Tax History Compared to Growth
Tax History
| Year | Tax Paid | Tax Assessment Tax Assessment Total Assessment is a certain percentage of the fair market value that is determined by local assessors to be the total taxable value of land and additions on the property. | Land | Improvement |
|---|---|---|---|---|
| 2024 | $333 | $489,645 | $270,928 | $218,717 |
| 2023 | $333 | $502,108 | $277,824 | $224,284 |
| 2022 | $413 | $432,853 | $239,504 | $129,326 |
| 2021 | $451 | $312,299 | $172,800 | $129,326 |
| 2020 | $468 | $289,166 | $160,000 | $129,166 |
| 2019 | $497 | $275,498 | $108,141 | $167,357 |
| 2018 | $2,529 | $247,298 | $97,091 | $150,207 |
| 2017 | $2,181 | $212,916 | $83,590 | $129,326 |
| 2016 | $1,909 | $191,928 | $75,010 | $116,918 |
| 2015 | $1,872 | $174,835 | $68,510 | $106,325 |
| 2014 | -- | $165,878 | $65,000 | $100,878 |
| 2013 | -- | $177,885 | $59,850 | $118,035 |
Source: Public Records
Map
Nearby Homes
- 2500 Meridian St
- 2600 Elm St
- 1800 J St
- 1410 J St
- 1315 Astor St
- 2805 Walnut St
- 1200 W Holly St
- 2218 Jaeger St
- 3008 Meridian St
- 3018 Elm St
- 2500 Cornwall Ave
- 2019 Cornwall Ave
- 1508 E Maplewood Ave
- 2111 Franklin St
- 1025 Granary Ave Unit 503
- 1025 Granary Ave Unit 404
- 1025 Granary Ave Unit 306
- 1025 Granary Ave Unit 506
- 1025 Granary Ave Unit 501-A
- 1025 Granary Ave Unit 307-B