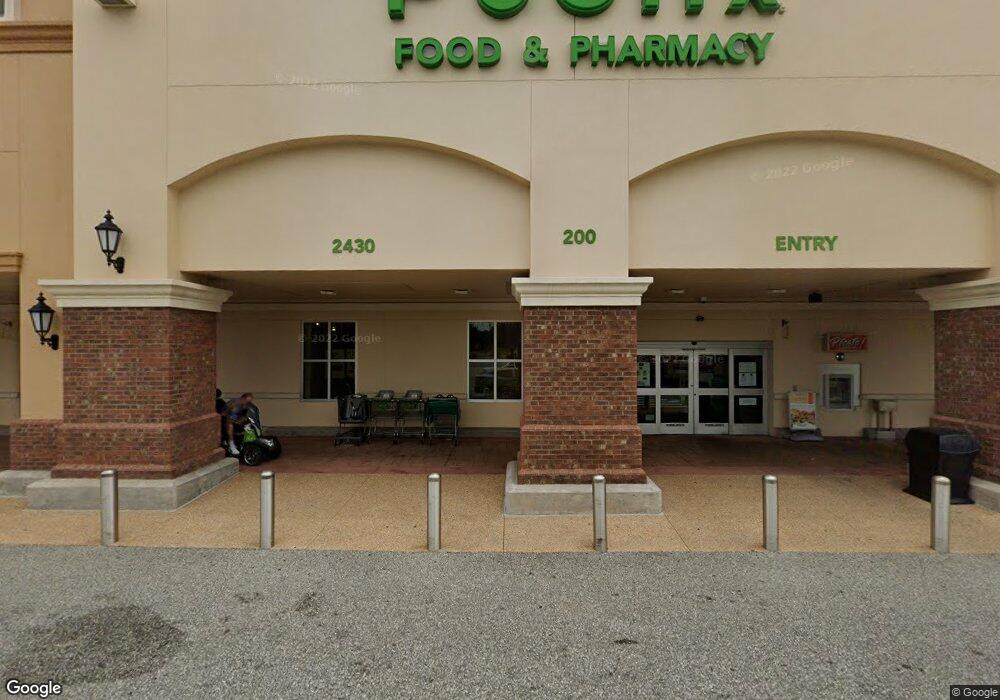
2430 U S 27 Unit 300 Clermont, FL 34714
Estimated Value: $21,623,420
--
Bed
10
Baths
64,694
Sq Ft
$334/Sq Ft
Est. Value
About This Home
This home is located at 2430 U S 27 Unit 300, Clermont, FL 34714 and is currently estimated at $21,623,420, approximately $334 per square foot. 2430 U S 27 Unit 300 is a home located in Lake County with nearby schools including Sawgrass Bay Elementary School, Windy Hill Middle School, and East Ridge High School.
Ownership History
Date
Name
Owned For
Owner Type
Purchase Details
Closed on
Oct 27, 2016
Sold by
Golden Eagle Investors Llc
Bought by
Golden Eagle Investors Llc
Current Estimated Value
Purchase Details
Closed on
Jun 23, 2014
Sold by
Eagleridge I Llc
Bought by
Golden Eagle Investor Llc
Home Financials for this Owner
Home Financials are based on the most recent Mortgage that was taken out on this home.
Original Mortgage
$7,500,000
Interest Rate
4.23%
Mortgage Type
Future Advance Clause Open End Mortgage
Purchase Details
Closed on
Jul 23, 2010
Sold by
Bpl Eagleridge Llc
Bought by
Eagleridge I Llc
Purchase Details
Closed on
Jun 5, 2008
Sold by
Bpl Hancock Llc
Bought by
Bpl Eagleridge Llc
Create a Home Valuation Report for This Property
The Home Valuation Report is an in-depth analysis detailing your home's value as well as a comparison with similar homes in the area
Home Values in the Area
Average Home Value in this Area
Purchase History
| Date | Buyer | Sale Price | Title Company |
|---|---|---|---|
| Golden Eagle Investors Llc | $11,200,000 | Attorney | |
| Golden Eagle Investor Llc | $9,450,000 | Attorney | |
| Golden Eagle Village Association Inc | -- | Attorney | |
| Eagleridge I Llc | -- | Attorney | |
| Bpl Eagleridge Llc | $10,000 | First American Title |
Source: Public Records
Mortgage History
| Date | Status | Borrower | Loan Amount |
|---|---|---|---|
| Previous Owner | Golden Eagle Village Association Inc | $7,500,000 |
Source: Public Records
Tax History Compared to Growth
Tax History
| Year | Tax Paid | Tax Assessment Tax Assessment Total Assessment is a certain percentage of the fair market value that is determined by local assessors to be the total taxable value of land and additions on the property. | Land | Improvement |
|---|---|---|---|---|
| 2025 | $115,769 | $7,964,703 | $3,008,755 | $4,955,948 |
| 2024 | $115,769 | $8,067,547 | $3,008,755 | $5,058,792 |
| 2023 | $115,769 | $7,535,200 | $2,735,419 | $4,799,781 |
| 2022 | $108,153 | $7,069,082 | $2,486,745 | $4,582,337 |
| 2021 | $113,237 | $7,234,960 | $0 | $0 |
| 2020 | $114,309 | $7,251,215 | $0 | $0 |
| 2019 | $113,765 | $6,830,396 | $0 | $0 |
| 2018 | $108,672 | $6,640,966 | $0 | $0 |
| 2017 | $106,731 | $6,581,479 | $0 | $0 |
| 2016 | $87,295 | $5,110,177 | $0 | $0 |
| 2015 | $90,414 | $5,126,696 | $0 | $0 |
| 2014 | $91,028 | $5,142,781 | $0 | $0 |
Source: Public Records
Map
Nearby Homes
- 2414 Limewood Ave
- 2511 Limewood Ave
- 2415 Citrus Tree Rd
- 2440 Citrus Tree Rd
- 2307 Limewood Ave
- 2311 Limewood Ave Unit 274
- 2450 Cypress St
- 2414 Cypress St Unit 232
- 2439 Palm St Unit 214
- 16329 Cherry Tree Ct
- 16357 Cherry Tree Ct
- 2428 Palm St
- 16129 Palm Frond Ave
- 2326 Limewood Ave
- 16345 Cherry Tree Ct
- 2227 Majestic Eagle Cir
- 16408 Bay St Unit 107
- 16409 Bay St Unit 116
- 16512 Sunshine Ave Unit 66
- 16724 Sunshine Ave Unit 97
- 2433 Limewood Ave Unit 28
- 2433 Limewood Ave
- 2437 Limewood Ave Unit 27
- 2441 Limewood Ave
- 2441 Limewood Ave Unit 26
- 2429 Limewood Ave
- 2429 Limewood Ave Unit 29
- 2445 Limewood Ave Unit 25
- 2449 Limewood Ave
- 2421 Limewood Ave Unit 31
- 2421 Limewood Ave
- 2417 Limewood Ave
- 2503 Limewood Ave
- 2503 Limewood Ave Unit 22
- 2413 Limewood Ave
- 2413 Limewood Ave Unit 33
- 2507 Limewood Ave
- 2414 Limewood Ave Unit 303
- 2501 Arran Ct
- 2454 Limewood Ave