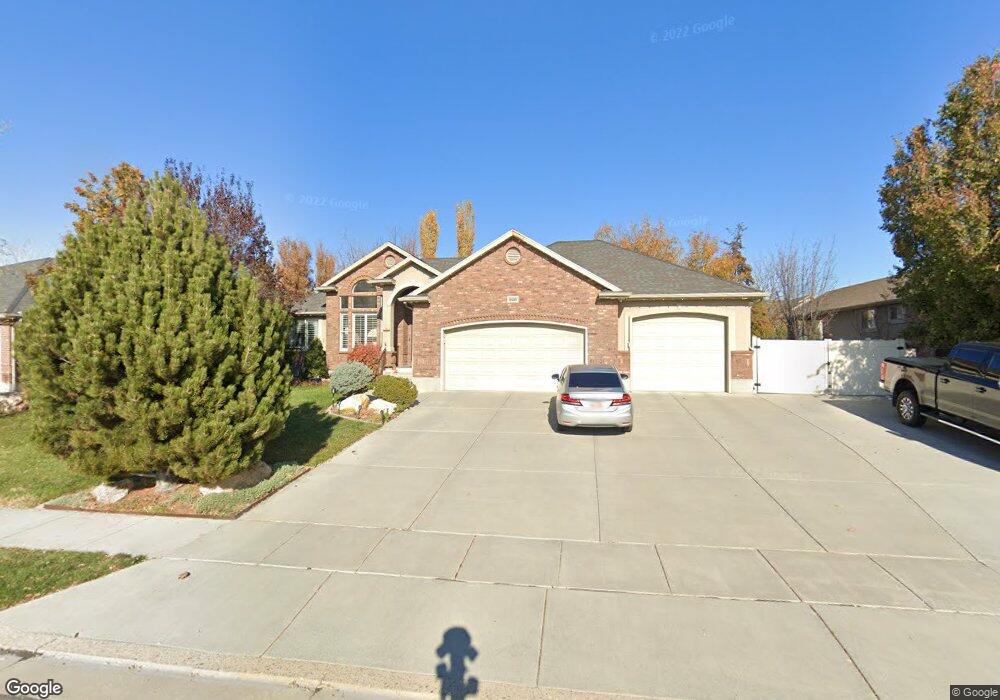
2430 W 775 N Layton, UT 84041
Estimated Value: $538,000 - $772,000
3
Beds
3
Baths
1,770
Sq Ft
$381/Sq Ft
Est. Value
About This Home
This home is located at 2430 W 775 N, Layton, UT 84041 and is currently estimated at $675,010, approximately $381 per square foot. 2430 W 775 N is a home located in Davis County with nearby schools including Ellison Park School, Shoreline Junior High School, and Layton High School.
Ownership History
Date
Name
Owned For
Owner Type
Purchase Details
Closed on
Mar 1, 2024
Sold by
Martin Jared and Martin Jennifer G
Bought by
Jelkc Haven Trust and Martin
Current Estimated Value
Purchase Details
Closed on
Mar 29, 2007
Sold by
Lynn Glauser Construction Lc
Bought by
England Brian C and England Chantel W
Home Financials for this Owner
Home Financials are based on the most recent Mortgage that was taken out on this home.
Original Mortgage
$277,136
Interest Rate
6.29%
Mortgage Type
New Conventional
Purchase Details
Closed on
Oct 27, 2006
Sold by
Shadybrook Associates Llc
Bought by
Lynn Glauser Construction Lc
Purchase Details
Closed on
Sep 7, 2005
Sold by
Green Edward D and Dale Green L
Bought by
Shadybrook Associates Llc
Create a Home Valuation Report for This Property
The Home Valuation Report is an in-depth analysis detailing your home's value as well as a comparison with similar homes in the area
Home Values in the Area
Average Home Value in this Area
Purchase History
| Date | Buyer | Sale Price | Title Company |
|---|---|---|---|
| Jelkc Haven Trust | -- | None Listed On Document | |
| England Brian C | -- | Security Title | |
| Lynn Glauser Construction Lc | -- | Accommodation | |
| Shadybrook Associates Llc | -- | Heritage West Title Ins Agen |
Source: Public Records
Mortgage History
| Date | Status | Borrower | Loan Amount |
|---|---|---|---|
| Previous Owner | England Brian C | $277,136 |
Source: Public Records
Tax History Compared to Growth
Tax History
| Year | Tax Paid | Tax Assessment Tax Assessment Total Assessment is a certain percentage of the fair market value that is determined by local assessors to be the total taxable value of land and additions on the property. | Land | Improvement |
|---|---|---|---|---|
| 2025 | $3,673 | $385,550 | $123,902 | $261,648 |
| 2024 | $3,511 | $371,250 | $134,239 | $237,011 |
| 2023 | $3,407 | $635,000 | $138,534 | $496,466 |
| 2022 | $3,603 | $364,650 | $82,795 | $281,855 |
| 2021 | $3,312 | $500,000 | $124,191 | $375,809 |
| 2020 | $3,025 | $438,000 | $105,497 | $332,503 |
| 2019 | $2,940 | $417,000 | $105,815 | $311,185 |
| 2018 | $2,718 | $387,000 | $93,075 | $293,925 |
| 2016 | $2,649 | $194,590 | $37,810 | $156,780 |
| 2015 | $2,312 | $161,205 | $37,810 | $123,395 |
| 2014 | $2,006 | $143,035 | $37,810 | $105,225 |
| 2013 | -- | $156,837 | $34,742 | $122,095 |
Source: Public Records
Map
Nearby Homes
- 818 N 2625 W
- 2153 W 775 N
- 1071 Jamie-Matt Cir
- 2631 W 1075 N
- 2036 W 775 N
- 2025 W 775 N
- 2115 W 1225 N
- 2543 W 1275 N
- 979 Cold Creek Way
- 916 Cold Creek Way
- 2438 W 1400 N
- 2681 S 200 E
- 2828 Brady Way
- 1211 N 1875 W Unit 211
- 1211 N 1875 W
- Fremont Plan at Trailside
- Blakely Plan at Trailside
- Arlington Plan at Trailside
- Savannah Plan at Trailside
- Charlotte Plan at Trailside