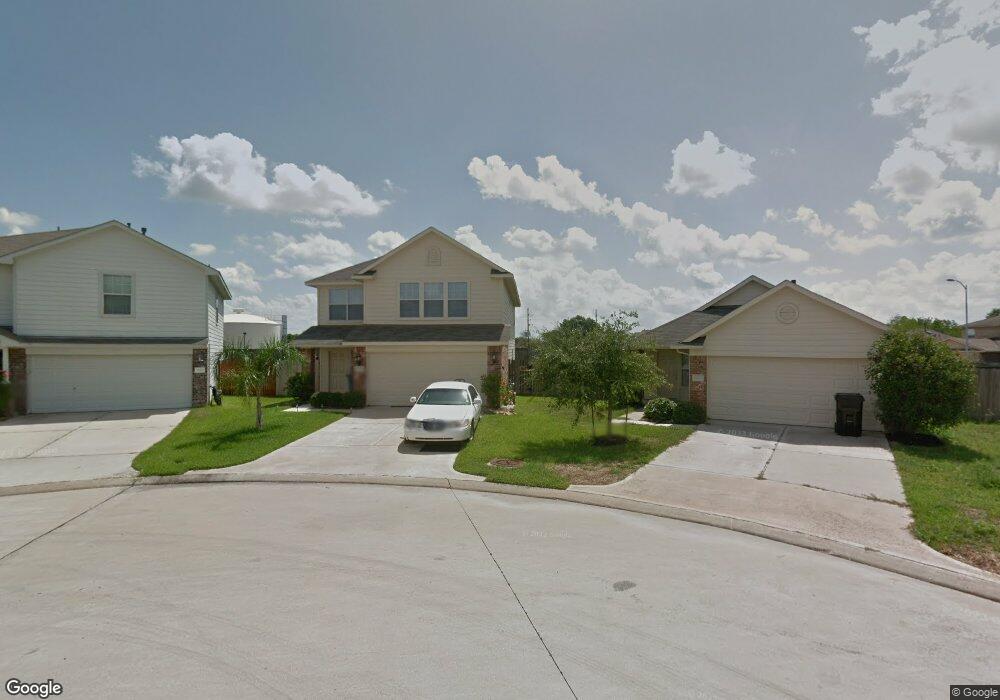
24303 Sandhill Trails Ct Hockley, TX 77447
Hockley NeighborhoodEstimated Value: $246,000 - $302,000
4
Beds
3
Baths
2,308
Sq Ft
$118/Sq Ft
Est. Value
About This Home
This home is located at 24303 Sandhill Trails Ct, Hockley, TX 77447 and is currently estimated at $272,156, approximately $117 per square foot. 24303 Sandhill Trails Ct is a home located in Harris County with nearby schools including Roberts Road Elementary School, Waller Junior High School, and Waller High School.
Ownership History
Date
Name
Owned For
Owner Type
Purchase Details
Closed on
Jul 24, 2012
Sold by
Mattiace Daniel M and Kirkendoli Carmon M
Bought by
Stevens Tony and Stevens Lorraine M
Current Estimated Value
Home Financials for this Owner
Home Financials are based on the most recent Mortgage that was taken out on this home.
Original Mortgage
$109,000
Outstanding Balance
$75,277
Interest Rate
3.68%
Mortgage Type
VA
Estimated Equity
$196,879
Purchase Details
Closed on
Mar 30, 2007
Sold by
Lennar Homes Of Texas Land & Const Ltd
Bought by
Lennar Homes Of Texas Sales & Mktg Ltd and Nuhome Of Texas
Purchase Details
Closed on
Mar 30, 2006
Sold by
Nuhome Of Texas
Bought by
Mattiace Daniel M and Kirkendoll Carmon M
Home Financials for this Owner
Home Financials are based on the most recent Mortgage that was taken out on this home.
Original Mortgage
$122,053
Interest Rate
6.24%
Mortgage Type
FHA
Create a Home Valuation Report for This Property
The Home Valuation Report is an in-depth analysis detailing your home's value as well as a comparison with similar homes in the area
Home Values in the Area
Average Home Value in this Area
Purchase History
| Date | Buyer | Sale Price | Title Company |
|---|---|---|---|
| Stevens Tony | -- | None Available | |
| Lennar Homes Of Texas Sales & Mktg Ltd | -- | North American Title Co | |
| Mattiace Daniel M | -- | North American Title Co |
Source: Public Records
Mortgage History
| Date | Status | Borrower | Loan Amount |
|---|---|---|---|
| Open | Stevens Tony | $109,000 | |
| Previous Owner | Mattiace Daniel M | $122,053 |
Source: Public Records
Tax History Compared to Growth
Tax History
| Year | Tax Paid | Tax Assessment Tax Assessment Total Assessment is a certain percentage of the fair market value that is determined by local assessors to be the total taxable value of land and additions on the property. | Land | Improvement |
|---|---|---|---|---|
| 2025 | -- | $265,153 | $41,828 | $223,325 |
| 2024 | -- | $263,241 | $41,828 | $221,413 |
| 2023 | $5,694 | $282,022 | $41,828 | $240,194 |
| 2022 | $5,633 | $238,525 | $35,820 | $202,705 |
| 2021 | $5,362 | $191,794 | $27,731 | $164,063 |
| 2020 | $5,198 | $180,069 | $27,731 | $152,338 |
| 2019 | $5,253 | $175,965 | $23,110 | $152,855 |
| 2018 | $1,040 | $166,556 | $19,874 | $146,682 |
| 2017 | $8,653 | $166,556 | $19,874 | $146,682 |
| 2016 | $3,933 | $166,556 | $19,874 | $146,682 |
| 2015 | $1,824 | $136,792 | $19,874 | $116,918 |
| 2014 | $1,824 | $114,414 | $18,488 | $95,926 |
Source: Public Records
Map
Nearby Homes
- 24335 Palm Cockatoo Dr
- 17135 Falcons Nest Landing Dr
- 24010 Palo Dura Dr
- 17222 Osprey Landing Dr
- 24519 Cypresspark Glen Ln
- 24231 Wild Horse Ln
- 24402 Bar Kay Ln
- 24211 Four Sixes Ln
- 24503 Wild Horse Ln
- 24303 Four Sixes Ln
- 17247 Osprey Forest Dr
- 17506 Bullis Gap Dr
- 2076 Stallion Lakes Ave
- 24402 Jumping Jay Dr
- 17603 Lavender Blossom Ln
- 17607 Lavender Blossom Ln
- 17111 Bluebonnet Creek Trail
- 17107 Bluebonnet Creek Trail
- Colorado Plan at Dellrose - Texas Classic Series
- Maverick Plan at Dellrose - Texas Classic Series
- 24307 Sandhill Trails Ct
- 24302 Sandhill Trails Ct
- 24311 Sandhill Trails Ct
- 24306 Sandhill Trails Ct
- 24315 Sandhill Trails Ct
- 24314 Sandhills Trail
- 24310 Sandhill Trails Ct
- 24314 Sandhill Trails Ct
- 24323 Palo Dura Dr
- 24311 Palo Dura Dr
- 24315 Palo Dura Dr
- 24327 Palo Dura Dr
- 24307 Palo Dura Dr
- 24319 Palo Dura Dr
- 24327 Palm Cockatoo Dr
- 24319 Palm Cockatoo Dr
- 24331 Palm Cockatoo Dr
- 24315 Palm Cockatoo Dr
- 24303 Palo Dura Dr
- 24311 Palm Cockatoo Dr