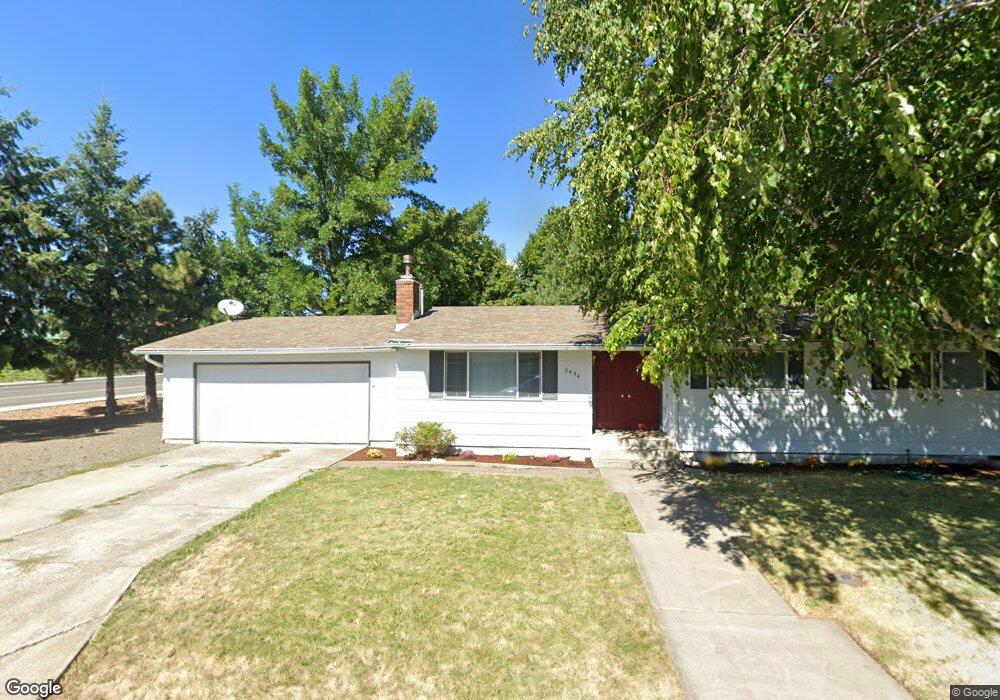
2431 Century Loop La Grande, OR 97850
Estimated Value: $317,883 - $376,000
3
Beds
2
Baths
1,344
Sq Ft
$258/Sq Ft
Est. Value
About This Home
This home is located at 2431 Century Loop, La Grande, OR 97850 and is currently estimated at $346,942, approximately $258 per square foot. 2431 Century Loop is a home located in Union County with nearby schools including La Grande High School, The Marian Academy, and Grande Ronde Academy.
Ownership History
Date
Name
Owned For
Owner Type
Purchase Details
Closed on
Jul 18, 2014
Sold by
Miller Ryan S and Miller Angie C
Bought by
Stockhoff Dana L
Current Estimated Value
Home Financials for this Owner
Home Financials are based on the most recent Mortgage that was taken out on this home.
Original Mortgage
$175,510
Outstanding Balance
$133,144
Interest Rate
4.13%
Mortgage Type
New Conventional
Estimated Equity
$213,798
Purchase Details
Closed on
May 24, 2005
Sold by
Hugulet Kevin D
Bought by
Miller Ryan S and Miller Angle C
Home Financials for this Owner
Home Financials are based on the most recent Mortgage that was taken out on this home.
Original Mortgage
$104,000
Interest Rate
5.62%
Mortgage Type
Adjustable Rate Mortgage/ARM
Create a Home Valuation Report for This Property
The Home Valuation Report is an in-depth analysis detailing your home's value as well as a comparison with similar homes in the area
Home Values in the Area
Average Home Value in this Area
Purchase History
| Date | Buyer | Sale Price | Title Company |
|---|---|---|---|
| Stockhoff Dana L | $172,000 | Eastern Oregon Title Inc | |
| Miller Ryan S | $130,000 | None Available |
Source: Public Records
Mortgage History
| Date | Status | Borrower | Loan Amount |
|---|---|---|---|
| Open | Stockhoff Dana L | $175,510 | |
| Previous Owner | Miller Ryan S | $104,000 | |
| Previous Owner | Miller Ryan S | $13,000 |
Source: Public Records
Tax History Compared to Growth
Tax History
| Year | Tax Paid | Tax Assessment Tax Assessment Total Assessment is a certain percentage of the fair market value that is determined by local assessors to be the total taxable value of land and additions on the property. | Land | Improvement |
|---|---|---|---|---|
| 2025 | $3,738 | $206,530 | $75,810 | $130,720 |
| 2024 | $3,610 | $200,520 | $73,600 | $126,920 |
| 2023 | $3,546 | $194,680 | $71,460 | $123,220 |
| 2022 | $3,452 | $189,033 | $69,385 | $119,648 |
| 2021 | $3,365 | $183,528 | $67,823 | $115,705 |
| 2020 | $3,229 | $178,183 | $65,882 | $112,301 |
| 2019 | $3,162 | $172,994 | $64,122 | $108,872 |
| 2018 | $3,078 | $167,956 | $56,125 | $111,831 |
| 2017 | $2,990 | $163,065 | $54,812 | $108,253 |
| 2016 | $2,901 | $158,316 | $53,336 | $104,980 |
| 2015 | $2,399 | $153,705 | $51,842 | $101,863 |
| 2014 | $2,399 | $149,229 | $50,421 | $98,808 |
| 2013 | -- | $144,883 | $48,920 | $95,963 |
Source: Public Records
Map
Nearby Homes
- 2209 Terra Lee Ct
- 2132 Elevation Ct
- 313 12th St Unit 4
- 2129 Elevation Ct
- 2008 Scorpio Dr
- 2104 True Ave
- 2101 True Loop
- 2000 Scorpio Dr
- 2108 True Ave
- 0 Blue Mountain Dr Unit 8 19352869
- 0 Blue Mountain Dr Unit 9 19086277
- 1004 22nd St
- 4097 Gemini Dr
- 707 Highland Dr
- 2311 E L Ave
- 1902 Highland Dr
- 1009 13th St
- 0 Tax Id 19401 Unit 665044590
- 1904 E N Ave
- 1609 Gildcrest Dr
- 2433 Century Loop
- 2400 Century Loop
- 2402 Century Loop
- 208 20th St Unit 5
- 208 20th St Unit 4
- 208 20th St Unit 20
- 208 20th St Unit 13
- 208 20th St
- 208 20th St Unit 6
- 208 20th St Unit 16
- 208 20th St Unit 12
- 2430 Century Loop
- 2435 Century Loop
- 2450 Century Loop
- 2432 Century Loop
- 2434 Century Loop
- 111 20th St
- 2437 Century Loop
- 2401 Century Loop
- 2406 Century Loop