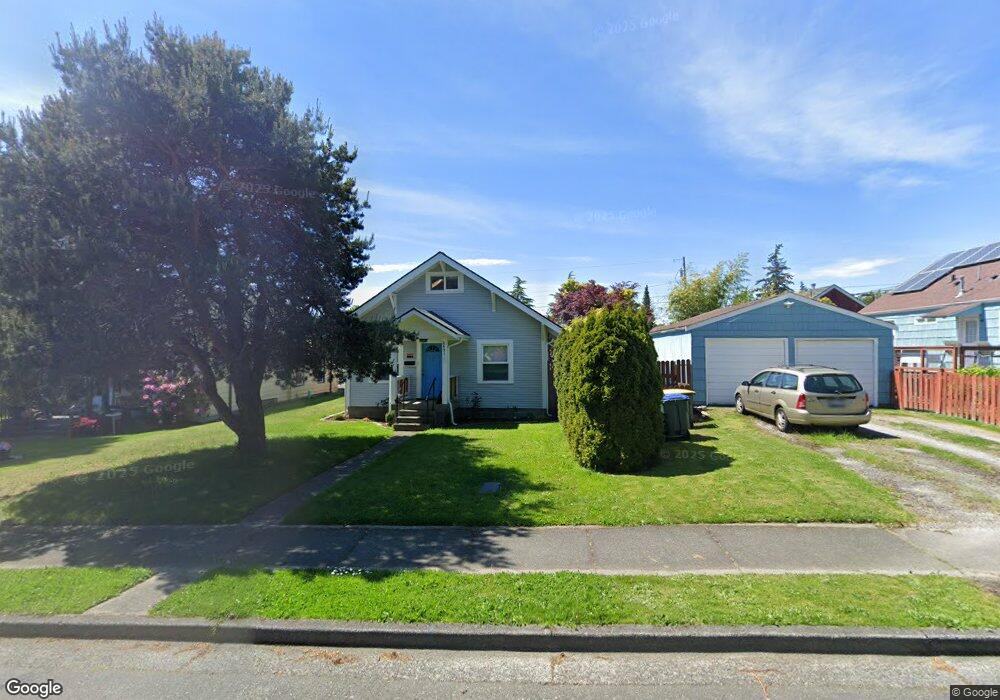
2431 Humboldt St Bellingham, WA 98225
Sunnyland NeighborhoodEstimated Value: $544,000 - $595,946
2
Beds
1
Bath
1,292
Sq Ft
$442/Sq Ft
Est. Value
About This Home
This home is located at 2431 Humboldt St, Bellingham, WA 98225 and is currently estimated at $570,987, approximately $441 per square foot. 2431 Humboldt St is a home located in Whatcom County with nearby schools including Sunnyland Elementary School, Whatcom Middle School, and Bellingham High School.
Ownership History
Date
Name
Owned For
Owner Type
Purchase Details
Closed on
Mar 3, 2020
Sold by
Eileen Clevenger and Eileen Kristen
Bought by
Eilee Cary and Eilee Kristen
Current Estimated Value
Purchase Details
Closed on
Jan 28, 2014
Sold by
Walters Leroy Bradley
Bought by
Walters Lauri J
Purchase Details
Closed on
Feb 3, 2012
Sold by
Walters Lauri J
Bought by
Walters Lauri J and Watlers Leroy B
Home Financials for this Owner
Home Financials are based on the most recent Mortgage that was taken out on this home.
Original Mortgage
$132,500
Interest Rate
3.9%
Mortgage Type
New Conventional
Purchase Details
Closed on
Sep 13, 2001
Sold by
Clift Kirk A and Clift Kym
Bought by
Kemp Lauri J
Home Financials for this Owner
Home Financials are based on the most recent Mortgage that was taken out on this home.
Original Mortgage
$128,978
Interest Rate
7%
Mortgage Type
FHA
Create a Home Valuation Report for This Property
The Home Valuation Report is an in-depth analysis detailing your home's value as well as a comparison with similar homes in the area
Home Values in the Area
Average Home Value in this Area
Purchase History
| Date | Buyer | Sale Price | Title Company |
|---|---|---|---|
| Eilee Cary | $10,000 | None Listed On Document | |
| Walters Lauri J | -- | None Available | |
| Walters Lauri J | -- | Whatcom Land Title | |
| Kemp Lauri J | $131,000 | Whatcom Land Title |
Source: Public Records
Mortgage History
| Date | Status | Borrower | Loan Amount |
|---|---|---|---|
| Previous Owner | Walters Lauri J | $132,500 | |
| Previous Owner | Kemp Lauri J | $128,978 |
Source: Public Records
Tax History Compared to Growth
Tax History
| Year | Tax Paid | Tax Assessment Tax Assessment Total Assessment is a certain percentage of the fair market value that is determined by local assessors to be the total taxable value of land and additions on the property. | Land | Improvement |
|---|---|---|---|---|
| 2024 | $4,197 | $525,839 | $246,304 | $279,535 |
| 2023 | $4,197 | $539,195 | $252,560 | $286,635 |
| 2022 | $3,427 | $464,832 | $217,728 | $247,104 |
| 2021 | $3,362 | $368,914 | $172,800 | $196,114 |
| 2020 | $3,267 | $341,587 | $160,000 | $181,587 |
| 2019 | $2,925 | $320,812 | $143,078 | $177,734 |
| 2018 | $2,945 | $287,979 | $128,458 | $159,521 |
| 2017 | $2,539 | $247,941 | $110,596 | $137,345 |
| 2016 | $2,222 | $223,411 | $99,244 | $124,167 |
| 2015 | $2,179 | $203,562 | $90,644 | $112,918 |
| 2014 | -- | $193,133 | $86,000 | $107,133 |
| 2013 | -- | $188,121 | $78,750 | $109,371 |
Source: Public Records
Map
Nearby Homes
- 2429 Humboldt St
- 512 Alabama St
- 2435 Humboldt St
- 2423 Humboldt St
- 2417 Humboldt St
- 2428 Grant St
- 2424 Grant St
- 2432 Grant St
- 2413 Humboldt St
- 2420 Grant St
- 2416 Grant St
- 2411 Humboldt St
- 2430 Humboldt St
- 2434 Humboldt St
- 2428 Humboldt St
- 2412 Grant St
- 513 Alabama St
- 519 Alabama St
- 2418 Humboldt St
- 2410 Grant St