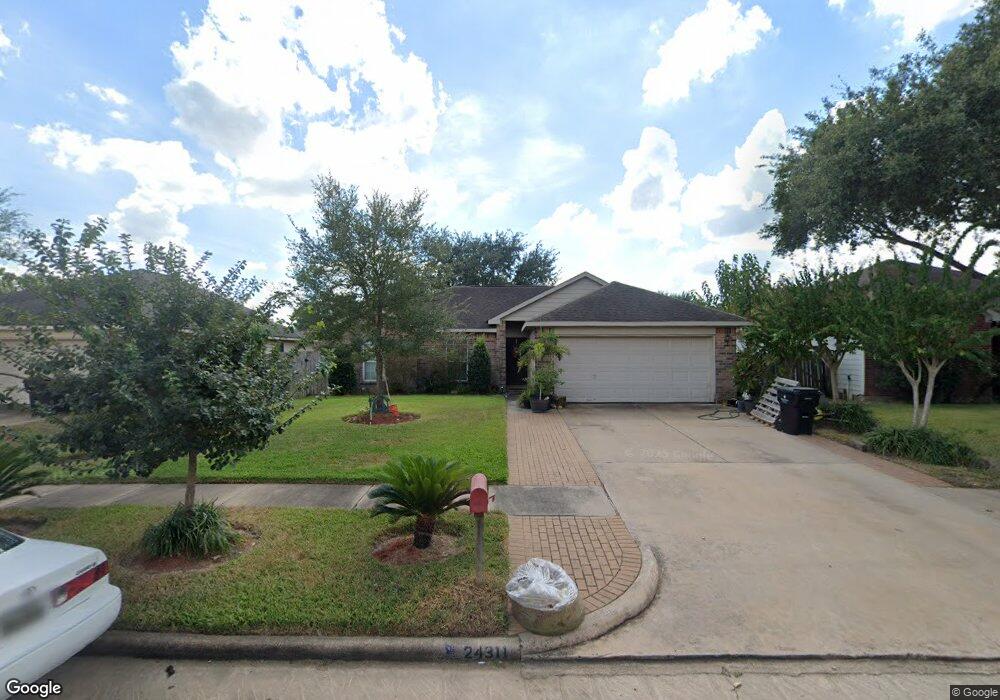
24311 Wild Horse Ln Hockley, TX 77447
Hockley NeighborhoodEstimated Value: $203,000 - $214,209
3
Beds
2
Baths
1,143
Sq Ft
$183/Sq Ft
Est. Value
About This Home
This home is located at 24311 Wild Horse Ln, Hockley, TX 77447 and is currently estimated at $209,052, approximately $182 per square foot. 24311 Wild Horse Ln is a home located in Harris County with nearby schools including Roberts Road Elementary School, Waller Junior High School, and Waller High School.
Ownership History
Date
Name
Owned For
Owner Type
Purchase Details
Closed on
Nov 20, 2019
Sold by
Anaya Martha L
Bought by
Ayala Nunez and Ordorica Karen Pamela
Current Estimated Value
Purchase Details
Closed on
Sep 23, 2014
Sold by
Wilkening Phillip and Barton Jennifer
Bought by
Anay Martha L
Home Financials for this Owner
Home Financials are based on the most recent Mortgage that was taken out on this home.
Original Mortgage
$86,487
Interest Rate
4.14%
Mortgage Type
FHA
Purchase Details
Closed on
Nov 24, 2003
Sold by
Choice Homes Inc
Bought by
Wilkening Phillip and Barton Jennifer
Home Financials for this Owner
Home Financials are based on the most recent Mortgage that was taken out on this home.
Original Mortgage
$83,858
Interest Rate
6.01%
Mortgage Type
FHA
Purchase Details
Closed on
Sep 9, 2003
Sold by
Brazos Street Apartments Llc
Bought by
Choice Homes Inc
Create a Home Valuation Report for This Property
The Home Valuation Report is an in-depth analysis detailing your home's value as well as a comparison with similar homes in the area
Home Values in the Area
Average Home Value in this Area
Purchase History
| Date | Buyer | Sale Price | Title Company |
|---|---|---|---|
| Ayala Nunez | -- | None Available | |
| Anay Martha L | -- | None Available | |
| Wilkening Phillip | -- | -- | |
| Choice Homes Inc | -- | Charter Title Company |
Source: Public Records
Mortgage History
| Date | Status | Borrower | Loan Amount |
|---|---|---|---|
| Previous Owner | Anay Martha L | $86,487 | |
| Previous Owner | Wilkening Phillip | $83,858 |
Source: Public Records
Tax History Compared to Growth
Tax History
| Year | Tax Paid | Tax Assessment Tax Assessment Total Assessment is a certain percentage of the fair market value that is determined by local assessors to be the total taxable value of land and additions on the property. | Land | Improvement |
|---|---|---|---|---|
| 2025 | $2,035 | $254,693 | $34,650 | $220,043 |
| 2024 | $2,035 | $216,900 | $34,650 | $182,250 |
| 2023 | $2,035 | $196,300 | $34,650 | $161,650 |
| 2022 | $4,859 | $192,500 | $34,650 | $157,850 |
| 2021 | $4,946 | $176,932 | $28,350 | $148,582 |
| 2020 | $4,342 | $150,414 | $26,775 | $123,639 |
| 2019 | $4,229 | $150,414 | $22,050 | $128,364 |
| 2018 | $912 | $128,797 | $22,050 | $106,747 |
| 2017 | $3,552 | $128,797 | $22,050 | $106,747 |
| 2016 | $3,356 | $113,557 | $22,050 | $91,507 |
| 2015 | $1,236 | $99,333 | $15,120 | $84,213 |
| 2014 | $1,236 | $66,850 | $15,120 | $51,730 |
Source: Public Records
Map
Nearby Homes
- 24303 Four Sixes Ln
- 24231 Wild Horse Ln
- 24402 Bar Kay Ln
- 24503 Wild Horse Ln
- 24211 Four Sixes Ln
- 17247 Osprey Forest Dr
- 2076 Stallion Lakes Ave
- 24402 Jumping Jay Dr
- 17222 Osprey Landing Dr
- 17506 Bullis Gap Dr
- 17135 Falcons Nest Landing Dr
- 24335 Palm Cockatoo Dr
- 24310 Rockin Seven Dr
- 24414 Broken Bow Ln
- 24039 Rockin Seven Dr
- 24519 Cypresspark Glen Ln
- 0 Lazy Kay Ln
- 17607 Lavender Blossom Ln
- 24010 Palo Dura Dr
- 17419 Lavender Blossom Ln
- 24315 Wild Horse Ln
- 24307 Wild Horse Ln
- 24310 Bar Kay Ln
- 24306 Bar Kay Ln
- 24319 Wild Horse Ln
- 24314 Bar Kay Ln
- 24302 Bar Kay Ln
- 24318 Bar Kay Ln
- 24310 Wild Horse Ln
- 24314 Wild Horse Ln
- 24306 Wild Horse Ln
- 24323 Wild Horse Ln
- 24318 Wild Horse Ln
- 24302 Wild Horse Ln
- 24230 Bar Kay Ln
- 24322 Bar Kay Ln
- 24227 Wild Horse Ln
- 24327 Wild Horse Ln
- 24322 Wild Horse Ln
- 24230 Wild Horse Ln