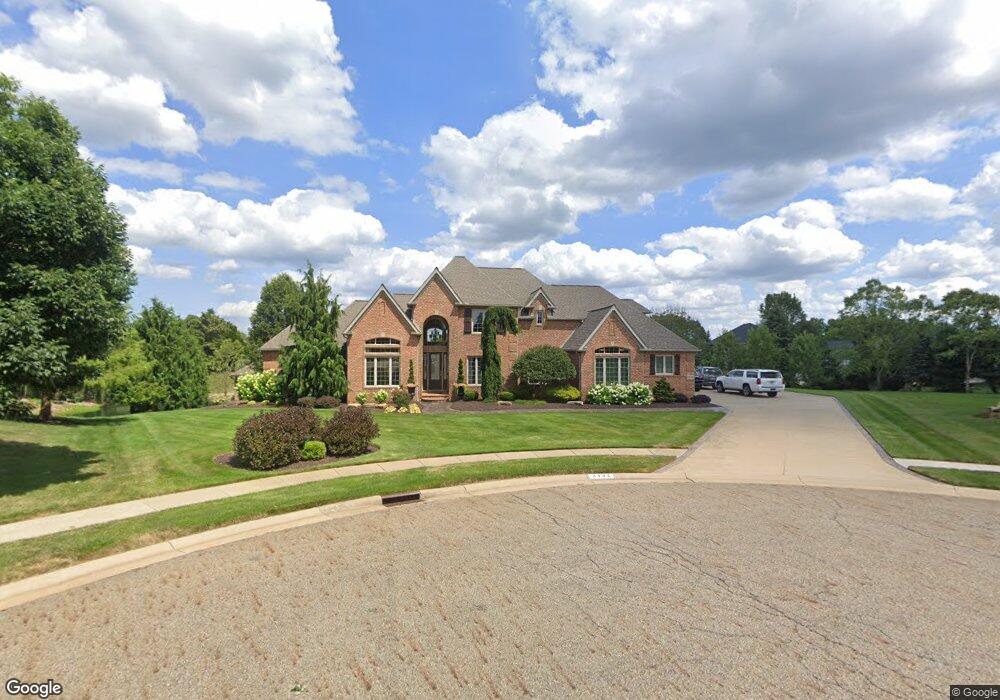
2432 Clydesdale St NW Canton, OH 44720
Estimated Value: $950,025 - $1,095,000
4
Beds
5
Baths
5,670
Sq Ft
$180/Sq Ft
Est. Value
About This Home
This home is located at 2432 Clydesdale St NW, Canton, OH 44720 and is currently estimated at $1,019,342, approximately $179 per square foot. 2432 Clydesdale St NW is a home located in Stark County with nearby schools including Northwood Elementary School, North Canton Middle School, and Hoover High School.
Ownership History
Date
Name
Owned For
Owner Type
Purchase Details
Closed on
Apr 29, 2011
Sold by
Cross Point Property Exchange Services L
Bought by
Schatz Joseph T and Schatz Christina M
Current Estimated Value
Purchase Details
Closed on
Feb 16, 2011
Sold by
Schatz Joseph T and Schatz Christina M
Bought by
Cross Point Property Exchange Services L
Purchase Details
Closed on
Jun 1, 2009
Sold by
Jamestown Homes Inc
Bought by
Schatz Christina M and Schatz Joseph T
Home Financials for this Owner
Home Financials are based on the most recent Mortgage that was taken out on this home.
Original Mortgage
$550,000
Interest Rate
6%
Mortgage Type
Purchase Money Mortgage
Purchase Details
Closed on
Oct 18, 2007
Sold by
Mckinley Development Co
Bought by
Jamestown Homes Inc
Home Financials for this Owner
Home Financials are based on the most recent Mortgage that was taken out on this home.
Original Mortgage
$570,000
Interest Rate
6.5%
Mortgage Type
Construction
Create a Home Valuation Report for This Property
The Home Valuation Report is an in-depth analysis detailing your home's value as well as a comparison with similar homes in the area
Home Values in the Area
Average Home Value in this Area
Purchase History
| Date | Buyer | Sale Price | Title Company |
|---|---|---|---|
| Schatz Joseph T | -- | Attorney | |
| Cross Point Property Exchange Services L | -- | Attorney | |
| Schatz Christina M | $556,000 | None Available | |
| Jamestown Homes Inc | $125,000 | Cornerstone Real Estate Titl |
Source: Public Records
Mortgage History
| Date | Status | Borrower | Loan Amount |
|---|---|---|---|
| Previous Owner | Schatz Christina M | $550,000 | |
| Previous Owner | Jamestown Homes Inc | $570,000 |
Source: Public Records
Tax History Compared to Growth
Tax History
| Year | Tax Paid | Tax Assessment Tax Assessment Total Assessment is a certain percentage of the fair market value that is determined by local assessors to be the total taxable value of land and additions on the property. | Land | Improvement |
|---|---|---|---|---|
| 2025 | -- | $357,180 | $72,070 | $285,110 |
| 2024 | -- | $357,180 | $72,070 | $285,110 |
| 2023 | $14,596 | $270,380 | $61,220 | $209,160 |
| 2022 | $14,010 | $270,380 | $61,220 | $209,160 |
| 2021 | $13,768 | $258,340 | $61,220 | $197,120 |
| 2020 | $12,403 | $212,280 | $56,140 | $156,140 |
| 2019 | $11,633 | $214,070 | $56,150 | $157,920 |
| 2018 | $12,154 | $214,070 | $56,150 | $157,920 |
| 2017 | $10,852 | $200,630 | $49,670 | $150,960 |
| 2016 | $10,894 | $200,630 | $49,670 | $150,960 |
| 2015 | $10,933 | $200,630 | $49,670 | $150,960 |
| 2014 | $750 | $186,630 | $46,170 | $140,460 |
| 2013 | $5,386 | $186,900 | $46,410 | $140,490 |
Source: Public Records
Map
Nearby Homes
- 8510 Deacon Ave NW
- 8173 Spencer Ave NW
- 2840 Barclay Cir NW
- 2315 Rutgers St NW
- 8835 Blitzen Rd NW
- 2884 Sutherland Cir NW
- 7995 Woodrush Dr NW
- 8271 Pheasant Ave NW
- 8275 Rolling Hill Ave NW
- 2626 Northam Cir NW
- 2452 Purdue Cir NW
- 9120 Bletchley Ave NW
- 9276 Shipton Cir NW
- 7831 Windbur Cir NW
- 7840 Newgate Ave NW
- 3077 Whitewood St NW
- 3278 Sumser St NW Unit 2
- 8037 Norriton Cir NW
- 9364 Pheasant Valley Ave NW
- 2677 Radford St NW
- 999 Clydesdale St NW
- 2439 Clydesdale St NW
- 2446 Clydesdale St NW
- 2381 MacNaughten St NW
- 2369 MacNaughten St NW
- 8727 Deacon Dr NW
- 8703 Deacon Ave NW
- 8745 Deacon Dr NW
- 2395 MacNaughten St NW
- 2484 Clydesdale St NW
- 2370 MacNaughten St NW
- 8761 Deacon Dr NW
- 2417 MacNaughten St NW
- 8783 Deacon Dr NW
- 8544 Witney Ave NW
- 2429 Mcginty Rd NW
- 2411 Mcginty Rd NW
- 2477 Mcginty Rd NW
- 8736 Deacon Dr NW
- 8591 Cauley Ave NW