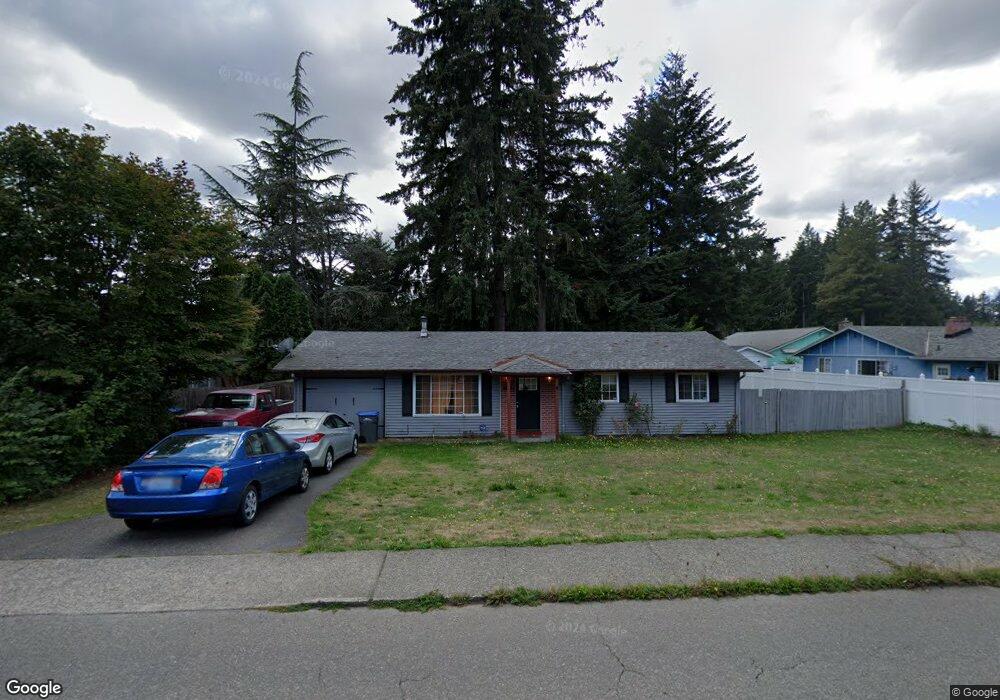
2432 Fircrest Dr SE Port Orchard, WA 98366
Parkwood NeighborhoodEstimated Value: $383,000 - $424,000
3
Beds
1
Bath
960
Sq Ft
$421/Sq Ft
Est. Value
About This Home
This home is located at 2432 Fircrest Dr SE, Port Orchard, WA 98366 and is currently estimated at $404,509, approximately $421 per square foot. 2432 Fircrest Dr SE is a home located in Kitsap County with nearby schools including Orchard Heights Elementary School, Marcus Whitman Middle School, and South Kitsap High School.
Ownership History
Date
Name
Owned For
Owner Type
Purchase Details
Closed on
Jan 22, 2016
Sold by
Baker Carolyn G
Bought by
Vanparys Vince and Van Parys Lisa
Current Estimated Value
Purchase Details
Closed on
Nov 15, 2006
Sold by
Martin Renee N and Cook Renee N
Bought by
Baker Carolyn G
Home Financials for this Owner
Home Financials are based on the most recent Mortgage that was taken out on this home.
Original Mortgage
$5,000
Interest Rate
6.37%
Mortgage Type
Stand Alone Second
Purchase Details
Closed on
Dec 9, 2003
Sold by
Household Realty Corp
Bought by
Cook Renee N
Home Financials for this Owner
Home Financials are based on the most recent Mortgage that was taken out on this home.
Original Mortgage
$106,200
Interest Rate
3.75%
Mortgage Type
Purchase Money Mortgage
Purchase Details
Closed on
Jun 3, 2003
Sold by
Justice George E and Justice Elizabeth A
Bought by
Household Realty Corp
Create a Home Valuation Report for This Property
The Home Valuation Report is an in-depth analysis detailing your home's value as well as a comparison with similar homes in the area
Home Values in the Area
Average Home Value in this Area
Purchase History
| Date | Buyer | Sale Price | Title Company |
|---|---|---|---|
| Vanparys Vince | $145,501 | None Available | |
| Baker Carolyn G | $204,780 | Transnation Title | |
| Cook Renee N | $118,000 | First American Title Ins | |
| Household Realty Corp | -- | Transnation Title Ins Co |
Source: Public Records
Mortgage History
| Date | Status | Borrower | Loan Amount |
|---|---|---|---|
| Previous Owner | Baker Carolyn G | $5,000 | |
| Previous Owner | Baker Carolyn G | $201,426 | |
| Previous Owner | Cook Renee N | $106,200 |
Source: Public Records
Tax History Compared to Growth
Tax History
| Year | Tax Paid | Tax Assessment Tax Assessment Total Assessment is a certain percentage of the fair market value that is determined by local assessors to be the total taxable value of land and additions on the property. | Land | Improvement |
|---|---|---|---|---|
| 2026 | $2,847 | $339,650 | $66,240 | $273,410 |
| 2025 | $2,847 | $319,220 | $58,050 | $261,170 |
| 2024 | $2,761 | $319,220 | $58,050 | $261,170 |
| 2023 | $2,742 | $319,220 | $58,050 | $261,170 |
| 2022 | $2,699 | $263,380 | $54,210 | $209,170 |
| 2021 | $2,299 | $211,120 | $50,370 | $160,750 |
| 2020 | $2,258 | $201,610 | $47,980 | $153,630 |
| 2019 | $1,917 | $187,080 | $47,100 | $139,980 |
| 2018 | $2,017 | $154,100 | $47,100 | $107,000 |
| 2017 | $1,739 | $154,100 | $47,100 | $107,000 |
| 2016 | $1,710 | $138,810 | $47,100 | $91,710 |
| 2015 | $1,658 | $136,400 | $47,100 | $89,300 |
| 2014 | -- | $133,990 | $47,100 | $86,890 |
| 2013 | -- | $130,840 | $49,580 | $81,260 |
Source: Public Records
Map
Nearby Homes
- 3300 Madrona Dr SE
- 2457 White Cedar Dr SE
- 2014 Kelowna Place SE
- 2475 Parkwood Dr SE
- 3884 Madrona Dr SE
- 2863 Rocky Creek Ln SE
- 2169 Ponderosa Dr SE
- 2808 Pine Cone Ct SE
- 4060 SE Saxon Ct
- 3930 SE Mile Hill Dr
- 3900 SE Mile Hill Dr
- 1663 Harrison Ave SE
- 3235 Westminster Dr SE
- 2124 Pine Tree Dr SE
- 2017 SE Juniper Ct
- 2116 Pine Tree Dr SE
- 2523 Jackson Ave SE
- 4010 SE Lovell St
- 5101 SE Natchez Ct
- 4258 SE Woodford Ct
- 2456 Fircrest Dr SE
- 2401 Lodgepole Dr SE
- 4083 SE Lodgepole Ct
- 2421 Lodgepole Dr SE
- 4101 SE Lodgepole Ct
- 2482 Fircrest Dr SE
- 2429 Lodgepole Dr SE
- 4075 SE Lodgepole Ct
- 4102 SE Lodgepole Ct
- 2394 Lodgepole Dr SE
- 2516 Fircrest Dr SE
- 2443 Lodgepole Dr SE
- 2422 Lodgepole Dr SE
- 2402 Lodgepole Dr SE
- 4047 SE Lodgepole Ct
- 4084 SE Lodgepole Ct
- 3277 Madrona Dr SE
- 4066 SE Lodgepole Ct
- 2467 Lodgepole Dr SE
- 2430 Lodgepole Dr SE