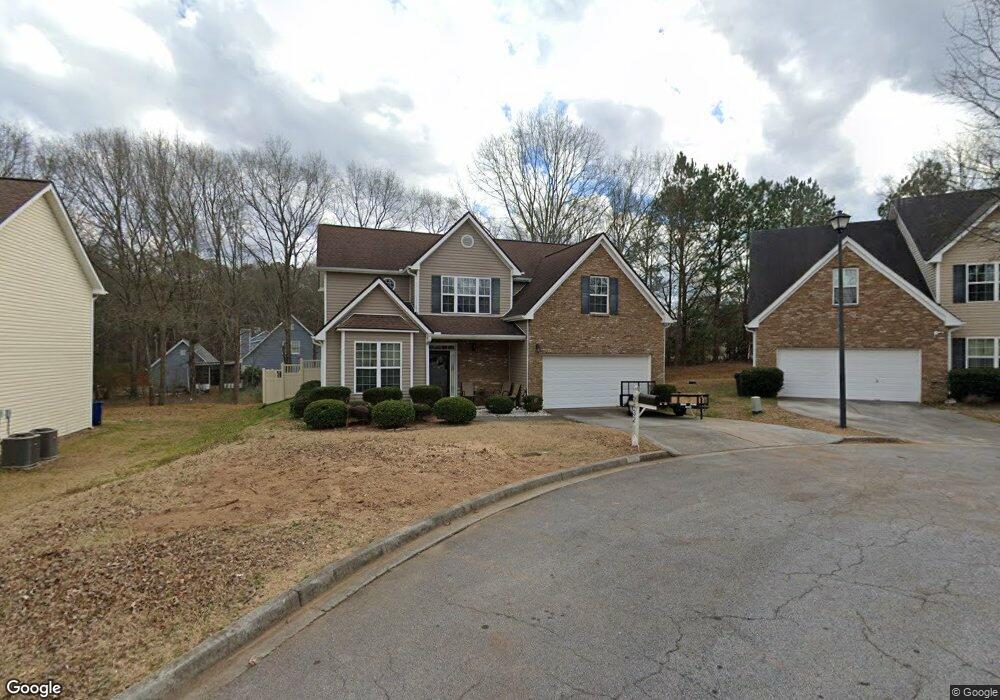
2432 Temple View Dr Unit 3 Snellville, GA 30078
Estimated Value: $332,000 - $372,000
4
Beds
3
Baths
1,974
Sq Ft
$177/Sq Ft
Est. Value
About This Home
This home is located at 2432 Temple View Dr Unit 3, Snellville, GA 30078 and is currently estimated at $350,175, approximately $177 per square foot. 2432 Temple View Dr Unit 3 is a home located in Gwinnett County with nearby schools including Norton Elementary School, Snellville Middle School, and South Gwinnett High School.
Ownership History
Date
Name
Owned For
Owner Type
Purchase Details
Closed on
Sep 17, 2010
Sold by
Peoples Bk
Bought by
Community & Southern Bank
Current Estimated Value
Purchase Details
Closed on
Mar 2, 2010
Sold by
Eastside Holdings Llc
Bought by
Peoples Bk
Purchase Details
Closed on
Apr 29, 2008
Sold by
Banks Leroy S and Banks Audrey B
Bought by
Eastside Holdings Llc
Purchase Details
Closed on
Jul 29, 2005
Sold by
Presidio Homes Llc
Bought by
Banks Leroy S
Home Financials for this Owner
Home Financials are based on the most recent Mortgage that was taken out on this home.
Original Mortgage
$181,150
Interest Rate
5.48%
Mortgage Type
VA
Create a Home Valuation Report for This Property
The Home Valuation Report is an in-depth analysis detailing your home's value as well as a comparison with similar homes in the area
Home Values in the Area
Average Home Value in this Area
Purchase History
| Date | Buyer | Sale Price | Title Company |
|---|---|---|---|
| Community & Southern Bank | -- | -- | |
| Peoples Bk | $140,841 | -- | |
| Eastside Holdings Llc | $176,000 | -- | |
| Banks Leroy S | $184,000 | -- |
Source: Public Records
Mortgage History
| Date | Status | Borrower | Loan Amount |
|---|---|---|---|
| Previous Owner | Banks Leroy S | $181,150 |
Source: Public Records
Tax History Compared to Growth
Tax History
| Year | Tax Paid | Tax Assessment Tax Assessment Total Assessment is a certain percentage of the fair market value that is determined by local assessors to be the total taxable value of land and additions on the property. | Land | Improvement |
|---|---|---|---|---|
| 2024 | $801 | $134,200 | $30,000 | $104,200 |
| 2023 | $801 | $137,360 | $29,680 | $107,680 |
| 2022 | $755 | $110,760 | $20,000 | $90,760 |
| 2021 | $744 | $88,360 | $16,000 | $72,360 |
| 2020 | $742 | $77,640 | $14,000 | $63,640 |
| 2019 | $691 | $77,640 | $14,000 | $63,640 |
| 2018 | $2,180 | $70,280 | $12,000 | $58,280 |
| 2016 | $1,997 | $60,760 | $8,800 | $51,960 |
| 2015 | $1,845 | $53,120 | $8,800 | $44,320 |
| 2014 | -- | $53,120 | $8,800 | $44,320 |
Source: Public Records
Map
Nearby Homes
- 2289 Pate Brook Rd
- 3206 Pate Creek View
- 3276 Pate Creek View
- 3491 Skyland Ridge Ct
- 2433 Hidden Ln
- 3186 Laurel Way
- 3630 Millers Pond Way SW
- 3190 Grand Central Dr
- 3127 Hidden Forest Dr
- 2405 Ivy Way
- 2050 Lyda Ln
- 2523 Meadowbrook Way
- 3720 Millers Pond Way SW
- 3414 Preserve Run Trail Unit 5
- 2280 Village Centre Dr Unit 1
- 3054 Periwinkle Dr Unit 2
- 3079 Lenora Church Rd
- 2136 Briarwood Ct
- 2432 Temple View Dr
- 2432 Temple View Dr
- 2442 Temple View Dr
- 2452 Temple View Dr
- 2452 Temple View Dr Unit 3
- 2412 Temple View Dr Unit 3
- 3420 Pate Rd
- 2423 Temple View Dr
- 2462 Temple View Dr Unit 3
- 2402 Temple View Dr Unit 3
- 2403 Temple View Dr Unit 3
- 2473 Temple View Dr Unit 3
- 2472 Temple View Dr
- 2472 Temple View Dr Unit 3
- 2392 Temple View Dr
- 2393 Temple View Dr
- 3407 Pate Rd
- 3431 Pate Rd
- 2483 Temple View Dr
- 2382 Temple View Dr