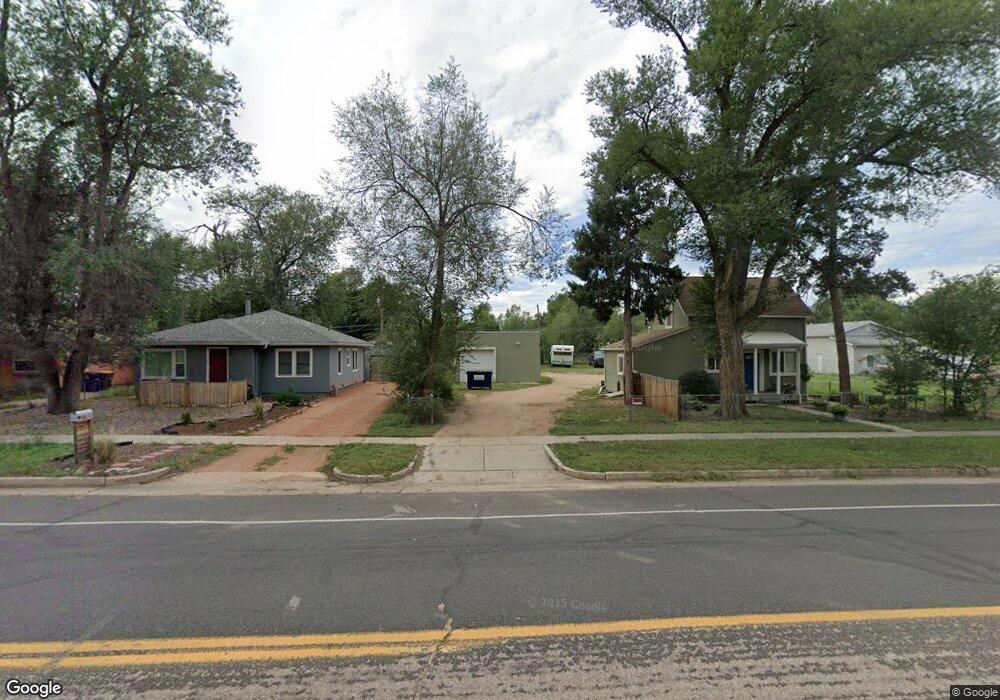
2433 E Willamette Ave Colorado Springs, CO 80909
Knob Hill NeighborhoodEstimated Value: $263,000 - $389,000
1
Bed
3
Baths
864
Sq Ft
$362/Sq Ft
Est. Value
About This Home
This home is located at 2433 E Willamette Ave, Colorado Springs, CO 80909 and is currently estimated at $312,744, approximately $361 per square foot. 2433 E Willamette Ave is a home located in El Paso County with nearby schools including Rogers Elementary School, Galileo School Of Math And Science, and William J. Palmer High School.
Ownership History
Date
Name
Owned For
Owner Type
Purchase Details
Closed on
Jul 16, 2018
Sold by
Khederian Christopher E
Bought by
Khederian Christopher E and Khederian Dawn
Current Estimated Value
Home Financials for this Owner
Home Financials are based on the most recent Mortgage that was taken out on this home.
Original Mortgage
$150,000
Outstanding Balance
$129,997
Interest Rate
4.5%
Mortgage Type
New Conventional
Estimated Equity
$182,747
Purchase Details
Closed on
Oct 9, 2017
Sold by
Pryse Ii James Brice
Bought by
Khederian Christopher E
Purchase Details
Closed on
Mar 14, 2017
Sold by
Nph Llc
Bought by
Pryse Ii James Brice
Purchase Details
Closed on
Feb 26, 2010
Sold by
Gravatt Shirley M
Bought by
Nph Llc
Purchase Details
Closed on
Aug 7, 2009
Sold by
Gravatt Shirley M
Bought by
Gravatt Shirley M
Create a Home Valuation Report for This Property
The Home Valuation Report is an in-depth analysis detailing your home's value as well as a comparison with similar homes in the area
Home Values in the Area
Average Home Value in this Area
Purchase History
| Date | Buyer | Sale Price | Title Company |
|---|---|---|---|
| Khederian Christopher E | -- | None Available | |
| Khederian Christopher E | $90,000 | First American Title | |
| Pryse Ii James Brice | $60,000 | Heritage Title Co | |
| Nph Llc | $50,000 | Heritage Title | |
| Gravatt Shirley M | -- | None Available |
Source: Public Records
Mortgage History
| Date | Status | Borrower | Loan Amount |
|---|---|---|---|
| Open | Khederian Christopher E | $150,000 |
Source: Public Records
Tax History Compared to Growth
Tax History
| Year | Tax Paid | Tax Assessment Tax Assessment Total Assessment is a certain percentage of the fair market value that is determined by local assessors to be the total taxable value of land and additions on the property. | Land | Improvement |
|---|---|---|---|---|
| 2025 | $876 | $23,280 | -- | -- |
| 2024 | $768 | $20,150 | $3,430 | $16,720 |
| 2022 | $936 | $16,730 | $2,540 | $14,190 |
| 2021 | $1,016 | $17,220 | $2,620 | $14,600 |
| 2020 | $1,146 | $16,880 | $2,290 | $14,590 |
| 2019 | $1,140 | $16,880 | $2,290 | $14,590 |
| 2018 | $317 | $4,320 | $1,510 | $2,810 |
| 2017 | $300 | $4,320 | $1,510 | $2,810 |
| 2016 | $383 | $6,600 | $1,670 | $4,930 |
| 2015 | $381 | $6,600 | $1,670 | $4,930 |
| 2014 | $375 | $6,230 | $1,670 | $4,560 |
Source: Public Records
Map
Nearby Homes
- 2433 E Monument St
- 2415 E Willamette Ave
- 2453 E Willamette Ave Unit 12
- 2459 E Willamette Ave
- 2422 E St Vrain St
- 705 E Hills Rd
- 2413 E Saint Vrain St
- 2409 E Saint Vrain St
- 2524 1/2 E Willamette Ave
- 2405 E Saint Vrain St
- 519 Prairie Rd
- 815 E Hills Rd
- 2118 E St Vrain St
- 508 Sunset Rd
- 517 Yuma St
- 2531 Gunnison St
- 2514 E Bijou St
- 2111 E Cache La Poudre St
- 623 Swope Ave
- 919 Bennett Ave
- 2435 E Willamette Ave
- 2411 E Willamette Ave
- 0 E Willamette Ave Unit 1772322
- 0 E Willamette Ave Unit 7637854
- 2437 E Willamette Ave
- 2423 E Willamette Ave
- 2439 E Willamette Ave Unit A
- 2419 E Willamette Ave
- 2428 E Saint Vrain St
- 2432 E Saint Vrain St
- 2441 E Willamette Ave
- 2424 E Saint Vrain St
- 2436 E Saint Vrain St
- 2440 E Saint Vrain St
- 2440 E St Vrain St
- 2422 E Saint Vrain St
- 2418 E Saint Vrain St
- 2436 E Willamette Ave
- 2443 E Willamette Ave
- 2424 E Willamette Ave