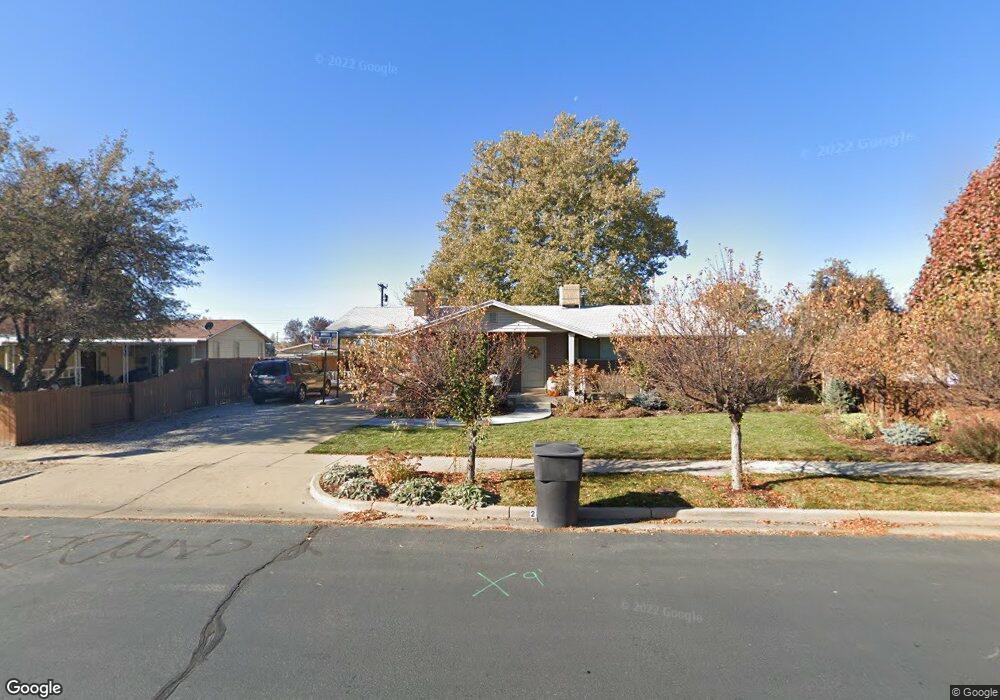
2433 N 770 W Clearfield, UT 84015
Estimated Value: $409,000 - $436,896
5
Beds
2
Baths
2,050
Sq Ft
$208/Sq Ft
Est. Value
About This Home
This home is located at 2433 N 770 W, Clearfield, UT 84015 and is currently estimated at $425,724, approximately $207 per square foot. 2433 N 770 W is a home located in Davis County with nearby schools including Fremont School, Sunset Junior High School, and Northridge High School.
Ownership History
Date
Name
Owned For
Owner Type
Purchase Details
Closed on
Mar 13, 2018
Sold by
John Alan W and John Danielle
Bought by
Taylor Kimberly and Taylor Jace
Current Estimated Value
Home Financials for this Owner
Home Financials are based on the most recent Mortgage that was taken out on this home.
Original Mortgage
$180,000
Outstanding Balance
$153,909
Interest Rate
4.38%
Mortgage Type
New Conventional
Estimated Equity
$271,815
Purchase Details
Closed on
Oct 8, 2008
Sold by
Dawson Corey and Dawson Adrienne
Bought by
John Alan W and John Danielle
Home Financials for this Owner
Home Financials are based on the most recent Mortgage that was taken out on this home.
Original Mortgage
$4,937
Interest Rate
6.39%
Mortgage Type
Stand Alone Second
Purchase Details
Closed on
Nov 6, 2003
Sold by
Tanner Stephen W
Bought by
Dawson Cory and Dawson Adrienne
Home Financials for this Owner
Home Financials are based on the most recent Mortgage that was taken out on this home.
Original Mortgage
$110,269
Interest Rate
5.94%
Mortgage Type
FHA
Purchase Details
Closed on
Jan 27, 2003
Sold by
Goudelock Dennis L and Goudelock Janice L
Bought by
Goudelock Dennis L and Goudelock Janice L
Purchase Details
Closed on
Oct 5, 2000
Sold by
Tanner Stephen W
Bought by
Tanner Stephen W
Purchase Details
Closed on
Jul 28, 1998
Sold by
Goudelock Dennis L and Goudelock Janice L
Bought by
Tanner Stephen W
Home Financials for this Owner
Home Financials are based on the most recent Mortgage that was taken out on this home.
Original Mortgage
$70,900
Interest Rate
6.93%
Purchase Details
Closed on
Dec 19, 1997
Sold by
Goudelock Dennis L and Goudelock Janice L
Bought by
Goudelock Dennis L and Goudelock Janice L
Home Financials for this Owner
Home Financials are based on the most recent Mortgage that was taken out on this home.
Original Mortgage
$70,000
Interest Rate
7.23%
Create a Home Valuation Report for This Property
The Home Valuation Report is an in-depth analysis detailing your home's value as well as a comparison with similar homes in the area
Home Values in the Area
Average Home Value in this Area
Purchase History
| Date | Buyer | Sale Price | Title Company |
|---|---|---|---|
| Taylor Kimberly | -- | North American Title | |
| John Alan W | -- | Bonneville Superior Title | |
| Dawson Cory | -- | Backman Stewart Title Servic | |
| Goudelock Dennis L | -- | -- | |
| Tanner Stephen W | -- | -- | |
| Tanner Stephen W | -- | Access Title Company Inc | |
| Goudelock Dennis L | -- | Bonneville Title Company Inc | |
| Goudelock Dennis L | -- | Bonneville Title Company Inc |
Source: Public Records
Mortgage History
| Date | Status | Borrower | Loan Amount |
|---|---|---|---|
| Open | Taylor Kimberly | $180,000 | |
| Previous Owner | John Alan W | $4,937 | |
| Previous Owner | John Alan W | $139,117 | |
| Previous Owner | Dawson Cory | $110,269 | |
| Previous Owner | Tanner Stephen W | $70,900 | |
| Previous Owner | Goudelock Dennis L | $70,000 |
Source: Public Records
Tax History Compared to Growth
Tax History
| Year | Tax Paid | Tax Assessment Tax Assessment Total Assessment is a certain percentage of the fair market value that is determined by local assessors to be the total taxable value of land and additions on the property. | Land | Improvement |
|---|---|---|---|---|
| 2025 | $2,259 | $217,250 | $94,613 | $122,637 |
| 2024 | $2,179 | $210,650 | $103,551 | $107,099 |
| 2023 | $2,002 | $358,000 | $118,600 | $239,400 |
| 2022 | $2,240 | $221,650 | $71,592 | $150,058 |
| 2021 | $2,044 | $300,000 | $91,244 | $208,756 |
| 2020 | $1,769 | $257,000 | $78,401 | $178,599 |
| 2019 | $1,705 | $242,000 | $90,011 | $151,989 |
| 2018 | $1,506 | $210,000 | $75,820 | $134,180 |
| 2016 | $1,158 | $83,380 | $29,705 | $53,675 |
| 2015 | $1,123 | $76,835 | $29,705 | $47,130 |
| 2014 | $1,112 | $77,308 | $29,705 | $47,603 |
| 2013 | -- | $71,338 | $25,230 | $46,108 |
Source: Public Records
Map
Nearby Homes