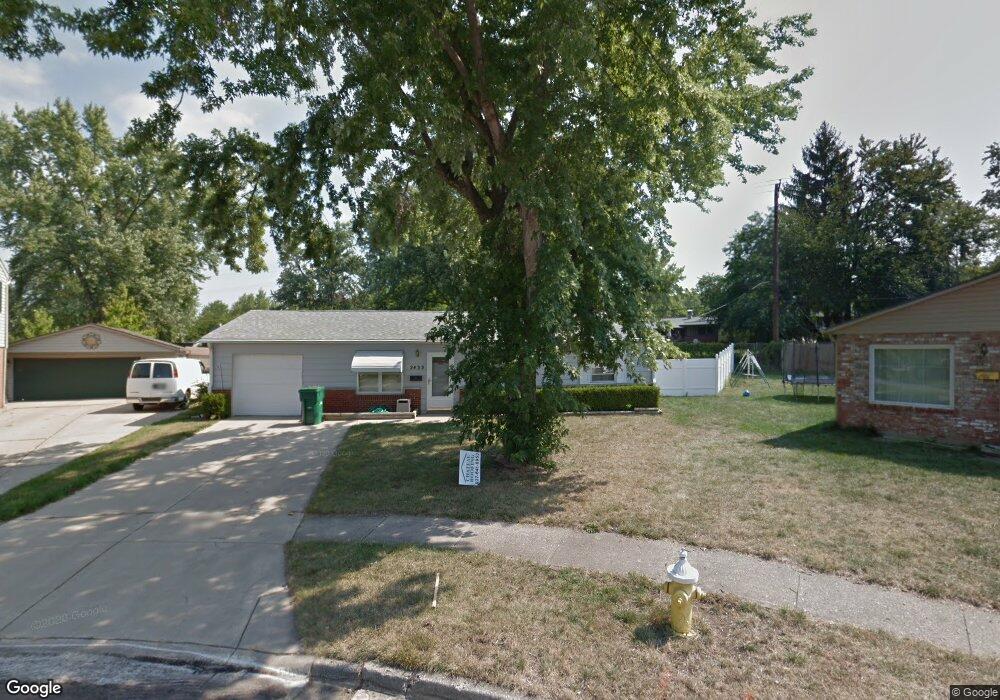
2433 Sheelah Ct Dayton, OH 45420
Estimated Value: $188,058 - $219,000
3
Beds
1
Bath
1,025
Sq Ft
$201/Sq Ft
Est. Value
About This Home
This home is located at 2433 Sheelah Ct, Dayton, OH 45420 and is currently estimated at $206,015, approximately $200 per square foot. 2433 Sheelah Ct is a home located in Montgomery County with nearby schools including Indian Riffle Elementary School, Kettering Middle School, and Kettering Fairmont High School.
Ownership History
Date
Name
Owned For
Owner Type
Purchase Details
Closed on
Apr 1, 2022
Sold by
Lade Thomas L and Lade Kimberly B
Bought by
Tklegacy1 Llc
Current Estimated Value
Purchase Details
Closed on
Aug 11, 2016
Sold by
Stanford David O
Bought by
Lade Thomas L and Lade Kimberly B
Home Financials for this Owner
Home Financials are based on the most recent Mortgage that was taken out on this home.
Original Mortgage
$87,750
Interest Rate
3.41%
Mortgage Type
New Conventional
Purchase Details
Closed on
Jun 26, 2015
Sold by
Sogard Michael
Bought by
Stanford David O
Home Financials for this Owner
Home Financials are based on the most recent Mortgage that was taken out on this home.
Original Mortgage
$106,043
Interest Rate
3.87%
Mortgage Type
FHA
Purchase Details
Closed on
Jun 2, 2015
Sold by
Newell William
Bought by
Sogard Michael
Home Financials for this Owner
Home Financials are based on the most recent Mortgage that was taken out on this home.
Original Mortgage
$106,043
Interest Rate
3.87%
Mortgage Type
FHA
Create a Home Valuation Report for This Property
The Home Valuation Report is an in-depth analysis detailing your home's value as well as a comparison with similar homes in the area
Home Values in the Area
Average Home Value in this Area
Purchase History
| Date | Buyer | Sale Price | Title Company |
|---|---|---|---|
| Tklegacy1 Llc | -- | None Listed On Document | |
| Lade Thomas L | $117,000 | Home Services Title Llc | |
| Stanford David O | $108,000 | Fidelity Lawyers Title Agenc | |
| Sogard Michael | -- | Attorney |
Source: Public Records
Mortgage History
| Date | Status | Borrower | Loan Amount |
|---|---|---|---|
| Previous Owner | Lade Thomas L | $87,750 | |
| Previous Owner | Stanford David O | $106,043 |
Source: Public Records
Tax History Compared to Growth
Tax History
| Year | Tax Paid | Tax Assessment Tax Assessment Total Assessment is a certain percentage of the fair market value that is determined by local assessors to be the total taxable value of land and additions on the property. | Land | Improvement |
|---|---|---|---|---|
| 2024 | $3,115 | $49,100 | $13,910 | $35,190 |
| 2023 | $3,115 | $49,100 | $13,910 | $35,190 |
| 2022 | $3,054 | $38,080 | $10,780 | $27,300 |
| 2021 | $2,829 | $38,080 | $10,780 | $27,300 |
| 2020 | $2,838 | $38,080 | $10,780 | $27,300 |
| 2019 | $2,655 | $31,490 | $10,780 | $20,710 |
| 2018 | $2,669 | $31,490 | $10,780 | $20,710 |
| 2017 | $2,465 | $31,490 | $10,780 | $20,710 |
| 2016 | $2,231 | $27,420 | $10,780 | $16,640 |
| 2015 | $1,458 | $27,420 | $10,780 | $16,640 |
| 2014 | $1,458 | $27,420 | $10,780 | $16,640 |
| 2012 | -- | $32,890 | $10,780 | $22,110 |
Source: Public Records
Map
Nearby Homes
- 3009 La Plata Dr
- 2432 Danube Ct
- 2301 Danube Ct
- 2512 Olson Dr
- 3428 Pobst Dr
- 2928 Prentice Dr
- 2843 Purdue Dr
- 3116 Powhattan Place
- 2845 Nacoma Place
- 2954 Powhattan Place
- 2808 Whitehorse Ave
- 2841 Chinook Ln
- 3525 Valleywood Dr
- 3241 Gracemore Ave
- 3072 Leonora Dr
- 1801 Boesel Ave
- 2530 Barryknoll St
- 1651 Beaverton Dr
- 1716 Willamet Rd
- 3201 Beaver Ave
- 2425 Sheelah Ct
- 2432 Sheelah Ct
- 3137 Delaney St
- 3141 Delaney St
- 3133 Delaney St
- 3145 Delaney St
- 2424 Suffolk Ct
- 2424 Sheelah Ct
- 3129 Delaney St
- 2432 Suffolk Ct
- 3149 Delaney St
- 2416 Sheelah Ct
- 2409 Sheelah Ct
- 2416 Suffolk Ct
- 3125 Delaney St
- 2408 Sheelah Ct
- 3201 Delaney St
- 2425 Lorna Ct
- 2408 Suffolk Ct
- 2401 Sheelah Ct