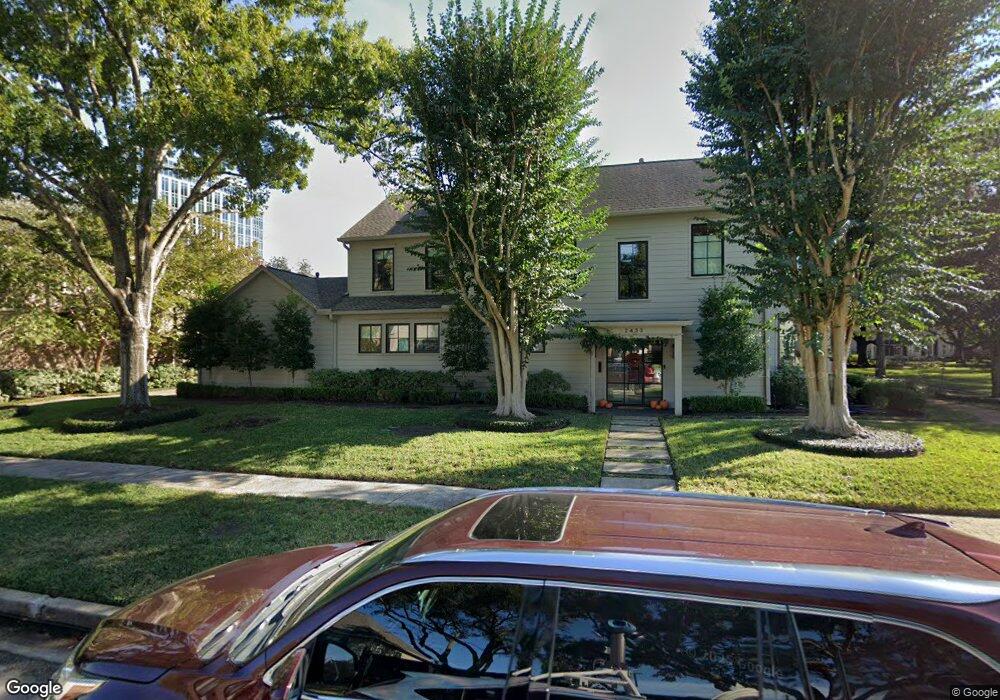
2433 Stanmore Dr Houston, TX 77019
River Oaks NeighborhoodEstimated Value: $2,963,997 - $3,819,000
5
Beds
5
Baths
4,483
Sq Ft
$758/Sq Ft
Est. Value
About This Home
This home is located at 2433 Stanmore Dr, Houston, TX 77019 and is currently estimated at $3,398,749, approximately $758 per square foot. 2433 Stanmore Dr is a home located in Harris County with nearby schools including River Oaks Elementary School, Lanier Middle School, and Lamar High School.
Ownership History
Date
Name
Owned For
Owner Type
Purchase Details
Closed on
Feb 29, 2012
Sold by
Harris Titus H and Harris Sylvia M
Bought by
Holcomb Brandon K and Holcomb Michelle
Current Estimated Value
Home Financials for this Owner
Home Financials are based on the most recent Mortgage that was taken out on this home.
Original Mortgage
$1,050,000
Outstanding Balance
$723,337
Interest Rate
3.93%
Mortgage Type
New Conventional
Estimated Equity
$2,675,412
Purchase Details
Closed on
Apr 12, 2007
Sold by
Massoud Elie A and Massoud Laura T
Bought by
Harris Titus H and Harris Sylvia M
Home Financials for this Owner
Home Financials are based on the most recent Mortgage that was taken out on this home.
Original Mortgage
$1,395,000
Interest Rate
6.19%
Mortgage Type
Purchase Money Mortgage
Purchase Details
Closed on
Jan 14, 2000
Sold by
Kirkland John D and Kirkland Kate Sayen
Bought by
Massoud Elie A and Massoud Laura T
Home Financials for this Owner
Home Financials are based on the most recent Mortgage that was taken out on this home.
Original Mortgage
$778,500
Interest Rate
7.84%
Create a Home Valuation Report for This Property
The Home Valuation Report is an in-depth analysis detailing your home's value as well as a comparison with similar homes in the area
Home Values in the Area
Average Home Value in this Area
Purchase History
| Date | Buyer | Sale Price | Title Company |
|---|---|---|---|
| Holcomb Brandon K | -- | Etc | |
| Harris Titus H | -- | Charter Title Company | |
| Massoud Elie A | -- | American Title Co |
Source: Public Records
Mortgage History
| Date | Status | Borrower | Loan Amount |
|---|---|---|---|
| Open | Holcomb Brandon K | $1,050,000 | |
| Previous Owner | Harris Titus H | $1,395,000 | |
| Previous Owner | Massoud Elie A | $778,500 |
Source: Public Records
Tax History Compared to Growth
Tax History
| Year | Tax Paid | Tax Assessment Tax Assessment Total Assessment is a certain percentage of the fair market value that is determined by local assessors to be the total taxable value of land and additions on the property. | Land | Improvement |
|---|---|---|---|---|
| 2025 | $39,821 | $3,360,000 | $1,885,125 | $1,474,875 |
| 2024 | $39,821 | $3,048,000 | $1,770,875 | $1,277,125 |
| 2023 | $39,821 | $2,206,016 | $1,713,750 | $492,266 |
| 2022 | $47,090 | $2,223,000 | $1,656,625 | $566,375 |
| 2021 | $45,312 | $1,944,189 | $1,542,375 | $401,814 |
| 2020 | $48,432 | $2,000,000 | $1,542,375 | $457,625 |
| 2019 | $50,075 | $1,978,883 | $1,542,375 | $436,508 |
| 2018 | $52,906 | $2,094,177 | $1,485,250 | $608,927 |
| 2017 | $45,434 | $1,940,000 | $1,485,250 | $454,750 |
| 2016 | $41,304 | $1,884,871 | $1,359,750 | $525,121 |
| 2015 | $27,728 | $1,763,500 | $1,311,188 | $452,312 |
| 2014 | $27,728 | $1,350,000 | $1,116,938 | $233,062 |
Source: Public Records
Map
Nearby Homes
- 2323 San Felipe St Unit 901
- 2323 San Felipe St Unit 1101
- 2323 San Felipe St Unit 602
- 1913 Revere St
- 2336 Welch St
- 2240 Mimosa Dr Unit 4W
- 2240 Mimosa Dr Unit 4N
- 2240 Mimosa Dr Unit PH-8W
- 2240 Mimosa Dr Unit 6W
- 2240 Mimosa Dr Unit 5W
- 2240 Mimosa Dr Unit 3N
- 2240 Mimosa Dr Unit 6E
- 2240 Mimosa Dr Unit PH-7E
- 2221 Welch St Unit 201
- 2221 Welch St Unit 401
- 2419 Mimosa Dr Unit 601
- 2419 Mimosa Dr Unit 801
- 2419 Mimosa Dr Unit 603
- 2103 Argonne St Unit B
- 2413 Mimosa Dr
- 2435 Stanmore Dr
- 2419 Stanmore Dr
- 2417 Stanmore Dr
- 2437 Stanmore Dr
- 2432 Stanmore Dr
- 2428 Stanmore Dr
- 2438 Stanmore Dr
- 2424 Stanmore Dr
- 2415 Stanmore Dr
- 2445 Stanmore Dr
- 2439 Stanmore Dr
- 2504 Stanmore Dr
- 2443 Stanmore Dr
- 2441 Stanmore Dr
- 2508 Stanmore Dr
- 2413 Stanmore Dr
- 2414 Stanmore Dr
- 2437 Pelham Dr
- 17 Winfield Gate
- 2427 Pelham Dr