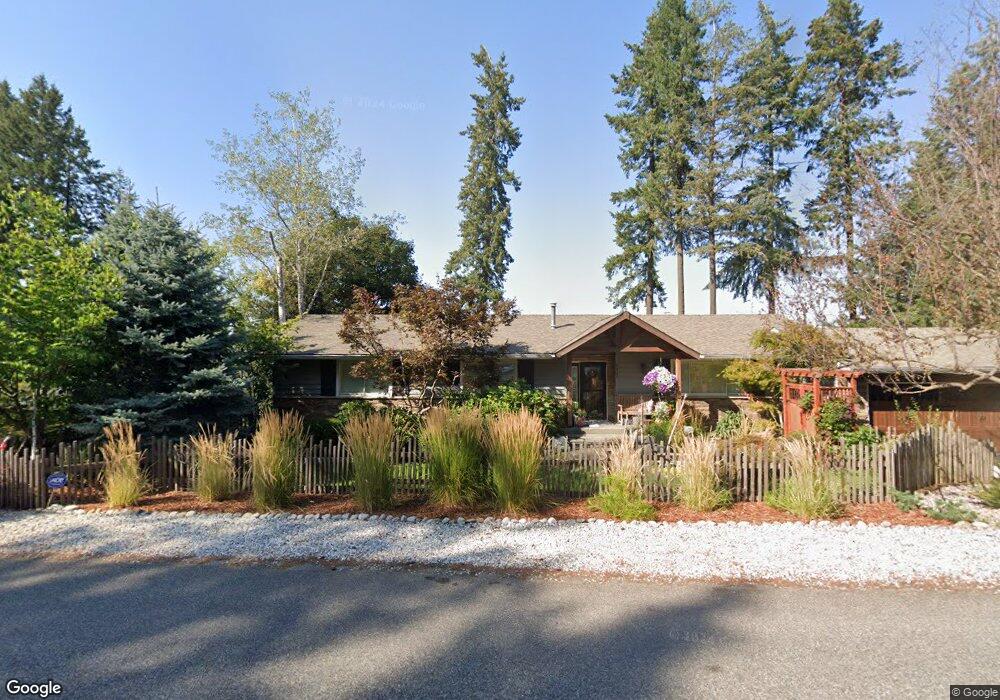
2435 E Hayden View Dr Coeur D Alene, ID 83815
Estimated Value: $943,432 - $1,142,000
4
Beds
4
Baths
3,693
Sq Ft
$270/Sq Ft
Est. Value
About This Home
This home is located at 2435 E Hayden View Dr, Coeur D Alene, ID 83815 and is currently estimated at $997,108, approximately $269 per square foot. 2435 E Hayden View Dr is a home located in Kootenai County with nearby schools including Dalton Elementary School, Canfield Middle School, and Coeur d'Alene High School.
Ownership History
Date
Name
Owned For
Owner Type
Purchase Details
Closed on
Dec 23, 2014
Sold by
Wallace Peter J
Bought by
Ryder David A and Ryder Maria
Current Estimated Value
Home Financials for this Owner
Home Financials are based on the most recent Mortgage that was taken out on this home.
Original Mortgage
$697,500
Outstanding Balance
$535,067
Interest Rate
3.96%
Mortgage Type
FHA
Estimated Equity
$462,041
Purchase Details
Closed on
Feb 21, 2012
Sold by
Clegg Andrea and Giordanella Scott
Bought by
Wallace Peter J
Purchase Details
Closed on
Apr 20, 2009
Sold by
Clegg Andrea and Glordanella Scott
Bought by
Clegg Andrea and Glordanella Scott
Home Financials for this Owner
Home Financials are based on the most recent Mortgage that was taken out on this home.
Original Mortgage
$350,000
Interest Rate
5.02%
Mortgage Type
New Conventional
Create a Home Valuation Report for This Property
The Home Valuation Report is an in-depth analysis detailing your home's value as well as a comparison with similar homes in the area
Home Values in the Area
Average Home Value in this Area
Purchase History
| Date | Buyer | Sale Price | Title Company |
|---|---|---|---|
| Ryder David A | -- | North Idaho Title Co | |
| Wallace Peter J | -- | North Idaho Title Co | |
| Clegg Andrea | -- | -- |
Source: Public Records
Mortgage History
| Date | Status | Borrower | Loan Amount |
|---|---|---|---|
| Open | Ryder David A | $697,500 | |
| Previous Owner | Clegg Andrea | $350,000 |
Source: Public Records
Tax History Compared to Growth
Tax History
| Year | Tax Paid | Tax Assessment Tax Assessment Total Assessment is a certain percentage of the fair market value that is determined by local assessors to be the total taxable value of land and additions on the property. | Land | Improvement |
|---|---|---|---|---|
| 2024 | $2,350 | $775,750 | $270,000 | $505,750 |
| 2023 | $2,350 | $927,131 | $300,000 | $627,131 |
| 2022 | $3,329 | $982,475 | $325,000 | $657,475 |
| 2021 | $2,996 | $594,349 | $200,000 | $394,349 |
| 2020 | $3,127 | $538,640 | $206,250 | $332,390 |
| 2019 | $3,049 | $492,453 | $165,000 | $327,453 |
| 2018 | $2,954 | $440,350 | $156,750 | $283,600 |
| 2017 | $3,168 | $441,430 | $165,000 | $276,430 |
| 2016 | $3,061 | $411,140 | $150,000 | $261,140 |
| 2015 | $2,714 | $362,464 | $151,734 | $210,730 |
| 2013 | $2,511 | $318,120 | $125,400 | $192,720 |
Source: Public Records
Map
Nearby Homes
- 2326 E Summit Dr
- 2304 E Grandview Dr
- 2010 E Grandview Dr
- 1985 E Grandview Dr
- 2177 E Grandview Dr
- 2735 E Packsaddle Dr
- 2060 E Woodstone Dr
- 2735 E Spyglass Ct
- 2699 E Packsaddle Dr
- 3139 E Hayden View Dr
- NKA E Sundown Dr
- 1692 E Pebblestone Ct
- 3163 E Lookout Dr
- 8385 N Selkirk Ct
- 2076 E Sundown Dr
- 2175 E Packsaddle Dr
- 1280 Glenmore Ct
- 7728 N 15th St
- 8533 N Tartan Dr
- 2484 E Woodstone Dr
- 2411 E Hayden View Dr
- 2465 E Hayden View Dr
- 2410 E Hayden View Dr
- 2464 E Hayden View Dr
- 2375 E Hayden View Dr
- 2220 E Upper Hayden Lake Rd
- 2206 E Upper Hayden Lake Rd
- 2360 E Hayden View Dr
- 2486 E Hayden View Dr
- 2501 E Hayden View Dr
- 2394 E Upper Hayden Lake Rd
- 2238 E Upper Hayden Lake Rd
- 2272 E Upper Hayden Lake Rd
- 2196 E Upper Hayden Lake Rd
- 2341 E Hayden View Dr
- 2174 E Upper Hayden Lake Rd
- 2141 Upper Hayden Lake
- 2529 E Hayden View Dr
- 2340 E Hayden View Dr
- 2316 Upper Hayden Lake