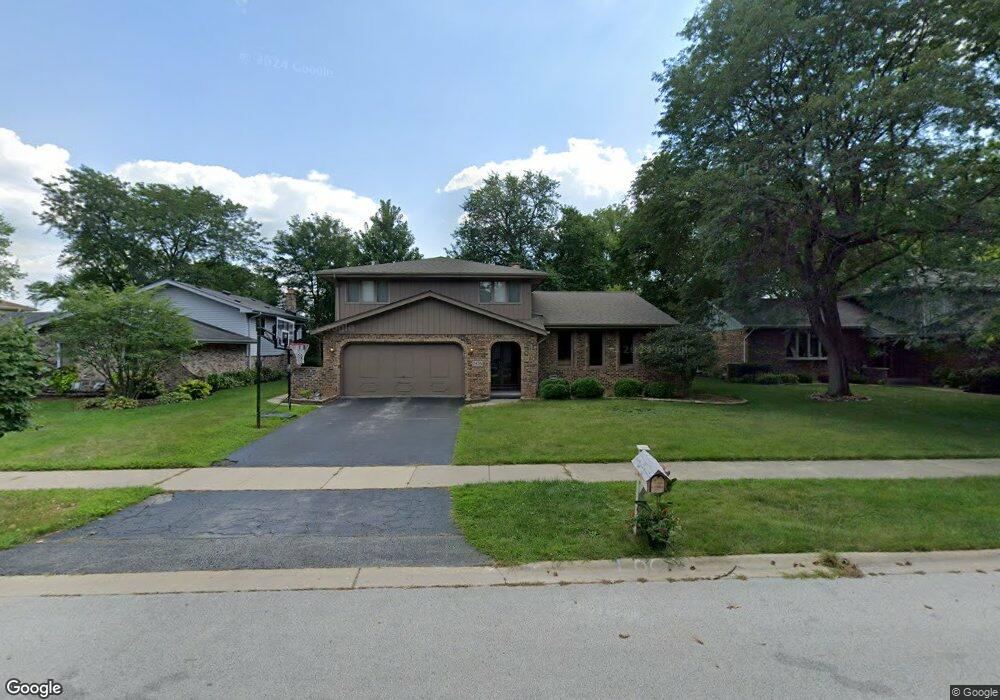
2435 Patricia Ln Homewood, IL 60430
Estimated Value: $293,225 - $429,000
4
Beds
2
Baths
1,569
Sq Ft
$225/Sq Ft
Est. Value
About This Home
This home is located at 2435 Patricia Ln, Homewood, IL 60430 and is currently estimated at $352,306, approximately $224 per square foot. 2435 Patricia Ln is a home located in Cook County with nearby schools including Willow Elementary School, Winston Churchill School, and James Hart School.
Ownership History
Date
Name
Owned For
Owner Type
Purchase Details
Closed on
Jul 28, 2017
Sold by
Thieman David G and Thieman Renee M
Bought by
Walker Frank and Walker Rita M
Current Estimated Value
Home Financials for this Owner
Home Financials are based on the most recent Mortgage that was taken out on this home.
Original Mortgage
$212,800
Outstanding Balance
$177,181
Interest Rate
3.88%
Mortgage Type
New Conventional
Estimated Equity
$175,125
Purchase Details
Closed on
Jul 18, 2003
Sold by
Filetti Richard A and Filetti Kathleen A
Bought by
Thieman David G and Thieman Renee M
Home Financials for this Owner
Home Financials are based on the most recent Mortgage that was taken out on this home.
Original Mortgage
$190,000
Interest Rate
6.02%
Mortgage Type
Unknown
Create a Home Valuation Report for This Property
The Home Valuation Report is an in-depth analysis detailing your home's value as well as a comparison with similar homes in the area
Home Values in the Area
Average Home Value in this Area
Purchase History
| Date | Buyer | Sale Price | Title Company |
|---|---|---|---|
| Walker Frank | $224,000 | Fidelity National Title | |
| Thieman David G | -- | -- |
Source: Public Records
Mortgage History
| Date | Status | Borrower | Loan Amount |
|---|---|---|---|
| Open | Walker Frank | $212,800 | |
| Previous Owner | Thieman David G | $190,000 | |
| Closed | Thieman David G | $35,625 |
Source: Public Records
Tax History Compared to Growth
Tax History
| Year | Tax Paid | Tax Assessment Tax Assessment Total Assessment is a certain percentage of the fair market value that is determined by local assessors to be the total taxable value of land and additions on the property. | Land | Improvement |
|---|---|---|---|---|
| 2024 | $9,256 | $26,001 | $5,828 | $20,173 |
| 2023 | $6,632 | $26,001 | $5,828 | $20,173 |
| 2022 | $6,632 | $16,418 | $4,995 | $11,423 |
| 2021 | $6,225 | $16,417 | $4,995 | $11,422 |
| 2020 | $8,021 | $20,455 | $4,995 | $15,460 |
| 2019 | $7,050 | $18,133 | $4,440 | $13,693 |
| 2018 | $8,412 | $18,133 | $4,440 | $13,693 |
| 2017 | $6,867 | $18,133 | $4,440 | $13,693 |
| 2016 | $6,018 | $15,130 | $3,885 | $11,245 |
| 2015 | $5,914 | $15,130 | $3,885 | $11,245 |
| 2014 | $5,827 | $15,130 | $3,885 | $11,245 |
| 2013 | $5,986 | $16,657 | $3,885 | $12,772 |
Source: Public Records
Map
Nearby Homes
- 18210 Perth Ave
- 18330 Perth Ave
- 18157 Rockwell Ave
- 18418 Clyde Rd
- 18450 Stedhall Rd
- 18104 Park Ave
- 18509 Stedhall Rd
- 18340 Cherry Creek Dr Unit 7
- 18400 Cherry Creek Dr Unit 105
- 18530 Stedhall Rd
- 2619 Alexander St
- 18134 Martin Ave Unit 18134
- 2055 183rd St
- 18051 Los Angeles Ave
- 18065 Harwood Ave Unit A
- 625 Perth Ave
- 2163 Chestnut Rd
- 18137 Martin Ave Unit 1NE
- 18461 Morris Ave
- 2807 Willow Rd Unit 103
- 2429 Patricia Ln
- 2423 Patricia Ln
- 2447 Patricia Ln
- 18253 Perth Ave
- 2434 Patricia Ln
- 2436 183rd St
- 2428 Patricia Ln
- 2440 Patricia Ln
- 2453 Patricia Ln
- 2417 Patricia Ln
- 2446 Patricia Ln
- 2422 Patricia Ln
- 2440 183rd St
- 2444 183rd St
- 2452 Patricia Ln
- 2411 Patricia Ln
- 2416 Patricia Ln
- 18255 Perth Ave
- 2400 Patricia Ln
- 2420 183rd St