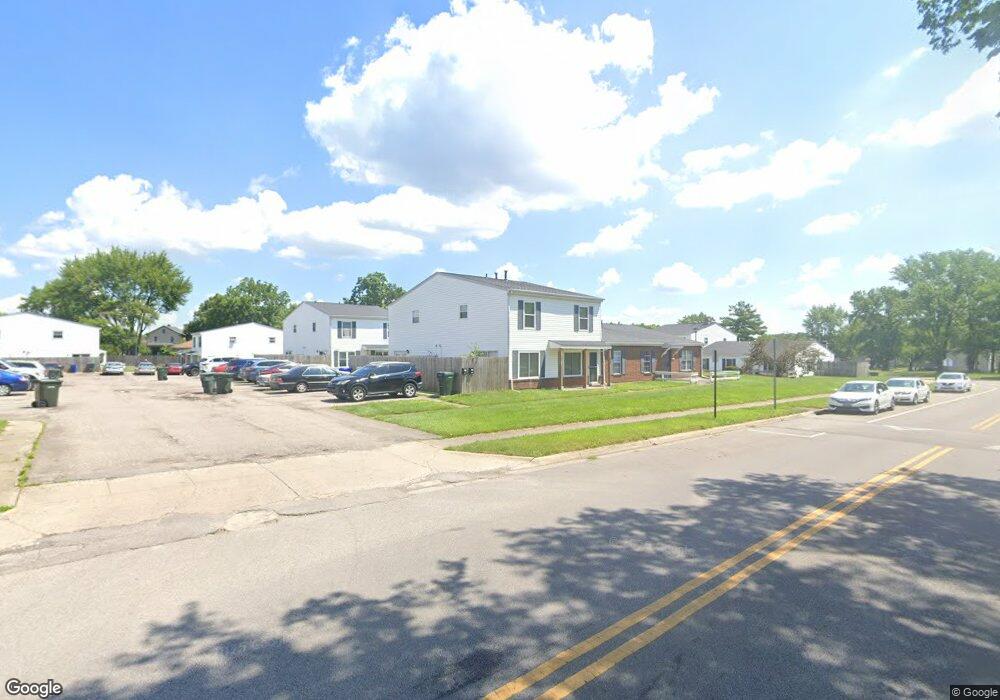
2435 Winding Hills Ct Unit 2435 Columbus, OH 43224
Walnut Creek NeighborhoodEstimated Value: $83,312 - $94,000
2
Beds
1
Bath
902
Sq Ft
$97/Sq Ft
Est. Value
About This Home
This home is located at 2435 Winding Hills Ct Unit 2435, Columbus, OH 43224 and is currently estimated at $87,771, approximately $97 per square foot. 2435 Winding Hills Ct Unit 2435 is a home located in Franklin County with nearby schools including Innis Elementary School, Mifflin Middle School, and Mifflin High School.
Ownership History
Date
Name
Owned For
Owner Type
Purchase Details
Closed on
Aug 9, 2013
Sold by
Fannie Mae
Bought by
Nur Abdikarim
Current Estimated Value
Purchase Details
Closed on
Nov 29, 2012
Sold by
Equityeast Llc
Bought by
Federal National Mortgage Association
Purchase Details
Closed on
Nov 17, 2008
Sold by
Smith Stanley E and Smith Cindy L
Bought by
Equityeast Llc
Purchase Details
Closed on
Mar 18, 2003
Sold by
Feaster Ruby
Bought by
Smith Stanley E and Smith Cindy L
Purchase Details
Closed on
Nov 27, 1991
Bought by
Feaster Ruby
Purchase Details
Closed on
May 1, 1985
Create a Home Valuation Report for This Property
The Home Valuation Report is an in-depth analysis detailing your home's value as well as a comparison with similar homes in the area
Home Values in the Area
Average Home Value in this Area
Purchase History
| Date | Buyer | Sale Price | Title Company |
|---|---|---|---|
| Nur Abdikarim | $15,500 | None Available | |
| Federal National Mortgage Association | $37,180 | None Available | |
| Equityeast Llc | -- | Attorney | |
| Smith Stanley E | $37,000 | Title First Agency Inc | |
| Feaster Ruby | $28,900 | -- | |
| -- | $27,500 | -- |
Source: Public Records
Tax History Compared to Growth
Tax History
| Year | Tax Paid | Tax Assessment Tax Assessment Total Assessment is a certain percentage of the fair market value that is determined by local assessors to be the total taxable value of land and additions on the property. | Land | Improvement |
|---|---|---|---|---|
| 2024 | $1,441 | $28,180 | $2,100 | $26,080 |
| 2023 | $1,425 | $28,175 | $2,100 | $26,075 |
| 2022 | $600 | $8,470 | $700 | $7,770 |
| 2021 | $601 | $8,470 | $700 | $7,770 |
| 2020 | $4,782 | $8,470 | $700 | $7,770 |
| 2019 | $751 | $6,520 | $530 | $5,990 |
| 2018 | $469 | $6,520 | $530 | $5,990 |
| 2017 | $455 | $6,520 | $530 | $5,990 |
| 2016 | $435 | $5,390 | $1,120 | $4,270 |
| 2015 | $383 | $5,390 | $1,120 | $4,270 |
| 2014 | $334 | $5,390 | $1,120 | $4,270 |
| 2013 | $194 | $6,335 | $1,330 | $5,005 |
Source: Public Records
Map
Nearby Homes
- 2450 Winding Hills Ct Unit 2450
- 2551-2553 Woodsedge Rd
- 3609 Westerville Rd Unit P-49
- 3286 Framington Dr
- 2621 Ipswick Cir
- 2503 Hingham Ln
- 3685 Cleveland Ave
- 2781 Innis Rd Unit C
- 2781 Innis Rd Unit F
- 2853 Stonecreek Ct Unit 2853
- 2529 Ferris Park Dr S
- 2547 Ferris Park Dr S
- 2219 Sale Rd
- 2015 Melrose Ave
- 2220 Sale Rd
- 3137 Westerville Rd Unit 44
- 3137 Westerville Rd Unit 91
- 2283 Ward Rd
- 1905 Elmore Ave
- 4090 Cleveland Ave
- 2435 Woodsedge Rd
- 2441 Winding Hills Ct
- 2437 Winding Hills Ct
- 2439 Winding Hills Ct
- 2475 Winding Hills Ct
- 2481 Winding Hills Ct
- 2443 Winding Hills Ct
- 2445 Winding Hills Ct
- 2469 Winding Hills Dr Unit 2469
- 2449 Winding Hills Ct Unit 2449
- 2447 Winding Hills Ct Unit 2447
- 2471 Winding Hills Dr Unit 2471
- 2473 Winding Hills Dr Unit 2473
- 2458 Winding Hills Court Columbus
- 2475 Winding Hills Dr Unit 2475
- 2440 Winding Hills Ct Unit 2440
- 2440 Winding Hills Dr
- 2490 Winding Hills Ct
- 2466 Winding Hills Ct
- 2432 Winding Hills Ct Unit 2432