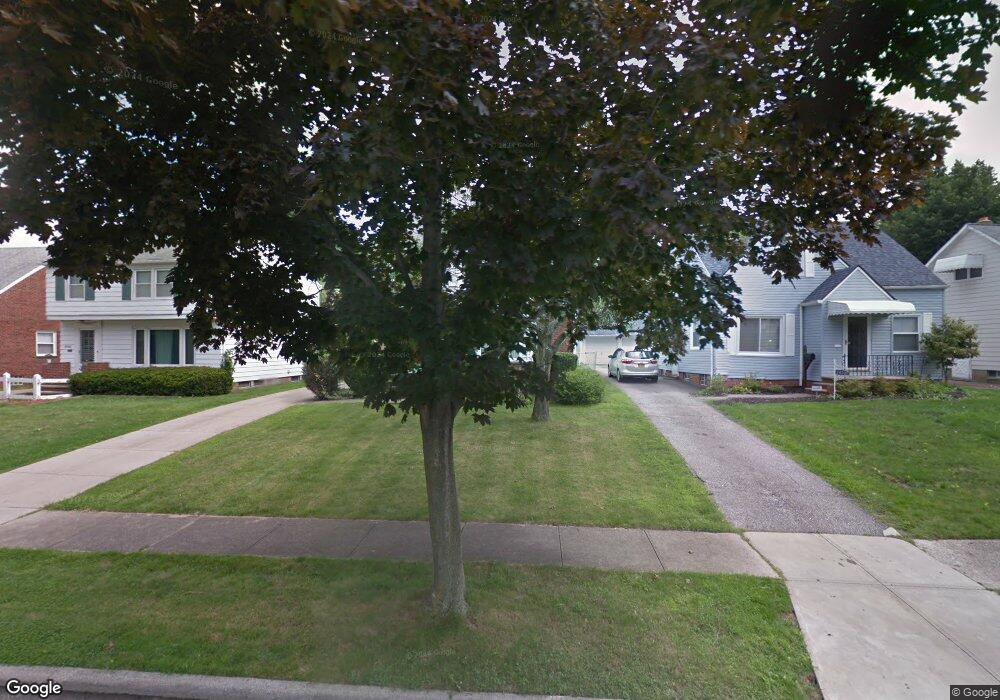
24350 Yosemite Dr Euclid, OH 44117
Estimated Value: $176,015 - $184,000
3
Beds
2
Baths
1,444
Sq Ft
$125/Sq Ft
Est. Value
About This Home
This home is located at 24350 Yosemite Dr, Euclid, OH 44117 and is currently estimated at $180,004, approximately $124 per square foot. 24350 Yosemite Dr is a home located in Cuyahoga County with nearby schools including Thomas Jefferson Elementary School, Euclid Middle School, and Euclid High School.
Ownership History
Date
Name
Owned For
Owner Type
Purchase Details
Closed on
Sep 22, 2003
Sold by
Kaleal David A and Kaleal Susan
Bought by
Croskey Parthenia M
Current Estimated Value
Home Financials for this Owner
Home Financials are based on the most recent Mortgage that was taken out on this home.
Original Mortgage
$147,327
Outstanding Balance
$69,284
Interest Rate
6.44%
Mortgage Type
FHA
Estimated Equity
$110,720
Purchase Details
Closed on
Mar 31, 1995
Sold by
Lapuh Edward J
Bought by
Kaleal David A and Dichiro Susan
Home Financials for this Owner
Home Financials are based on the most recent Mortgage that was taken out on this home.
Original Mortgage
$91,600
Interest Rate
8.91%
Mortgage Type
New Conventional
Purchase Details
Closed on
Jun 29, 1982
Sold by
Ullman Nancy R
Bought by
Lapuh Edward J
Purchase Details
Closed on
Jan 1, 1975
Bought by
Ullman Nancy R
Create a Home Valuation Report for This Property
The Home Valuation Report is an in-depth analysis detailing your home's value as well as a comparison with similar homes in the area
Home Values in the Area
Average Home Value in this Area
Purchase History
| Date | Buyer | Sale Price | Title Company |
|---|---|---|---|
| Croskey Parthenia M | $148,500 | Executive Title Agency Corp | |
| Kaleal David A | $114,500 | -- | |
| Lapuh Edward J | $72,500 | -- | |
| Ullman Nancy R | -- | -- |
Source: Public Records
Mortgage History
| Date | Status | Borrower | Loan Amount |
|---|---|---|---|
| Open | Croskey Parthenia M | $147,327 | |
| Previous Owner | Kaleal David A | $91,600 |
Source: Public Records
Tax History Compared to Growth
Tax History
| Year | Tax Paid | Tax Assessment Tax Assessment Total Assessment is a certain percentage of the fair market value that is determined by local assessors to be the total taxable value of land and additions on the property. | Land | Improvement |
|---|---|---|---|---|
| 2024 | $3,625 | $52,850 | $9,940 | $42,910 |
| 2023 | $3,521 | $41,060 | $7,770 | $33,290 |
| 2022 | $3,441 | $41,060 | $7,770 | $33,290 |
| 2021 | $3,836 | $41,060 | $7,770 | $33,290 |
| 2020 | $3,635 | $35,390 | $6,690 | $28,700 |
| 2019 | $3,271 | $101,100 | $19,100 | $82,000 |
| 2018 | $3,286 | $35,390 | $6,690 | $28,700 |
| 2017 | $3,546 | $31,750 | $5,360 | $26,390 |
| 2016 | $3,554 | $31,750 | $5,360 | $26,390 |
| 2015 | $3,232 | $31,750 | $5,360 | $26,390 |
| 2014 | $3,232 | $31,750 | $5,360 | $26,390 |
Source: Public Records
Map
Nearby Homes
- 1851 Beverly Hills Dr
- 1865 Idlehurst Dr
- 1836 Braeburn Park Dr
- 25321 Chatworth Dr
- 1620 E 243rd St
- 2093 Newcome St
- 24691 Hawthorne Dr
- 1864 Glen Oval
- 1823 Sunset Dr
- 1790 Skyline Dr
- 24105 Chardon Rd
- 23751 Glenbrook Blvd
- 23795 Greenwood Rd
- 24971 Euclid Ave
- 1696 E 236th St
- 1765 E 238th St
- 24720 Dundee Dr
- 25151 Euclid Ave
- 164 Richmond Rd
- 1774 E 236th St
- 24400 Yosemite Dr
- 24330 Yosemite Dr
- 24430 Yosemite Dr
- 24300 Yosemite Dr
- 24270 Yosemite Dr
- 24450 Yosemite Dr
- 1976 Idlehurst Dr
- 1978 Idlehurst Dr
- 24250 Yosemite Dr
- 24470 Yosemite Dr
- 1980 Idlehurst Dr
- 1974 Idlehurst Dr
- 24371 Yosemite Dr
- 24351 Yosemite Dr
- 24331 Yosemite Dr
- 24431 Yosemite Dr
- 24200 Yosemite Dr
- 1982 Idlehurst Dr
- 1970 Idlehurst Dr
- 24500 Yosemite Dr