Estimated Value: $390,068 - $465,000
3
Beds
1
Bath
1,883
Sq Ft
$222/Sq Ft
Est. Value
About This Home
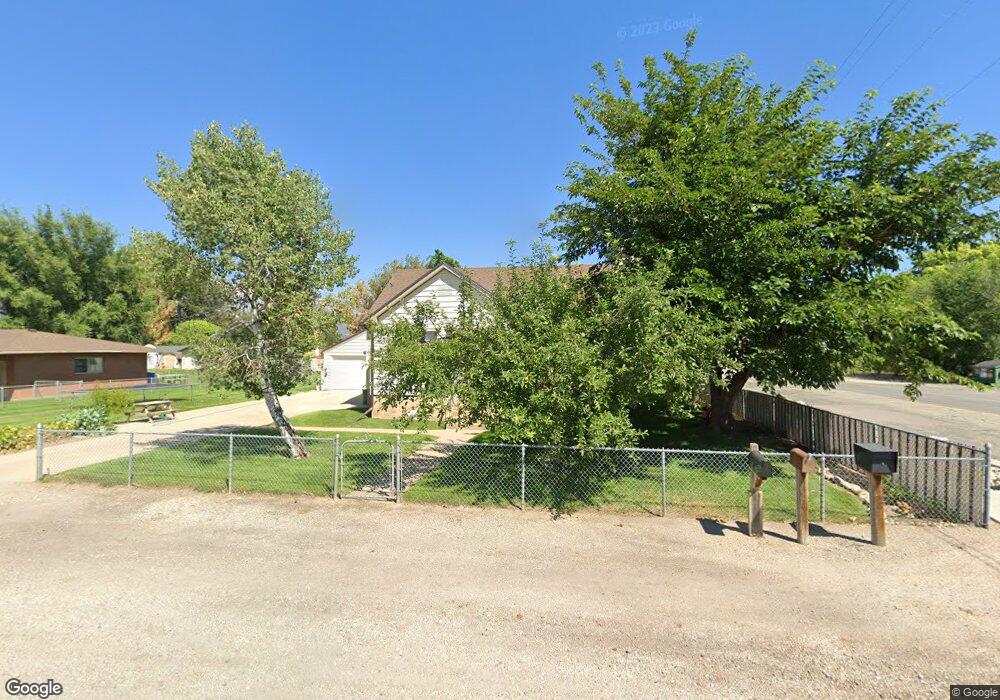
This home is located at 2436 N 4350 W, Ogden, UT 84404 and is currently estimated at $417,767, approximately $221 per square foot. 2436 N 4350 W is a home located in Weber County with nearby schools including Plain City School, Wahlquist Junior High School, and Fremont High School.
Ownership History
Date
Name
Owned For
Owner Type
Purchase Details
Closed on
Aug 29, 2018
Sold by
Kilgore Kay M
Bought by
Kilgore Kay and Kilgore Daniel G
Current Estimated Value
Home Financials for this Owner
Home Financials are based on the most recent Mortgage that was taken out on this home.
Original Mortgage
$500,000
Outstanding Balance
$435,131
Interest Rate
4.5%
Mortgage Type
New Conventional
Estimated Equity
-$17,364
Purchase Details
Closed on
Jan 27, 2009
Sold by
Taylor Bryce R and Taylor Andrea K
Bought by
Taylor Dallas and Taylor Annette
Purchase Details
Closed on
May 10, 2005
Sold by
Rosella Maw Family Trust and Taylor Annette M
Bought by
Taylor Bryce R and Taylor Andrea K
Home Financials for this Owner
Home Financials are based on the most recent Mortgage that was taken out on this home.
Original Mortgage
$104,000
Interest Rate
6.02%
Mortgage Type
Fannie Mae Freddie Mac
Create a Home Valuation Report for This Property
The Home Valuation Report is an in-depth analysis detailing your home's value as well as a comparison with similar homes in the area
Home Values in the Area
Average Home Value in this Area
Purchase History
| Date | Buyer | Sale Price | Title Company |
|---|---|---|---|
| Kilgore Kay | -- | Frontier Title Ins Agency | |
| Taylor Dallas | -- | Accommodation | |
| Taylor Bryce R | -- | Mountain View Title Ogden |
Source: Public Records
Mortgage History
| Date | Status | Borrower | Loan Amount |
|---|---|---|---|
| Open | Kilgore Kay | $500,000 | |
| Closed | Taylor Bryce R | $104,000 |
Source: Public Records
Tax History Compared to Growth
Tax History
| Year | Tax Paid | Tax Assessment Tax Assessment Total Assessment is a certain percentage of the fair market value that is determined by local assessors to be the total taxable value of land and additions on the property. | Land | Improvement |
|---|---|---|---|---|
| 2025 | $2,129 | $367,291 | $150,488 | $216,803 |
| 2024 | $2,051 | $361,999 | $150,484 | $211,515 |
| 2023 | $1,876 | $328,000 | $135,693 | $192,307 |
| 2022 | $1,966 | $358,000 | $131,044 | $226,956 |
| 2021 | $1,688 | $280,000 | $62,281 | $217,719 |
| 2020 | $1,653 | $253,000 | $52,426 | $200,574 |
| 2019 | $1,564 | $224,000 | $47,915 | $176,085 |
| 2018 | $1,493 | $203,001 | $47,915 | $155,086 |
| 2017 | $1,292 | $162,000 | $42,409 | $119,591 |
| 2016 | $1,181 | $79,619 | $21,352 | $58,267 |
| 2015 | $1,167 | $76,895 | $21,352 | $55,543 |
| 2014 | $1,106 | $70,720 | $22,422 | $48,298 |
Source: Public Records
Map
Nearby Homes
- 2416 N 4275 W
- 2700 N 4200 W
- 2793 W 2775 N
- 2797 W 2775 N Unit 129
- 2782 W 2775 N Unit 105
- 2792 W 2775 N Unit 103
- 4210 W 1975 N
- 2131 N 4650 W
- 3966 W 2200 N
- 3622 W 2200 St N Unit 23
- 4188 W 2875 N
- 3963 2800 North St
- 1885 N 4475 W
- 1748 N 4100 St W
- 4227 W Pioneer Rd
- 2255 N 3600 St W Unit 21
- 2233 N 3600 St W Unit 22
- 3594 W 2200 N Unit 3
- 4212 W 1975 N
- 4494 W 1600 N