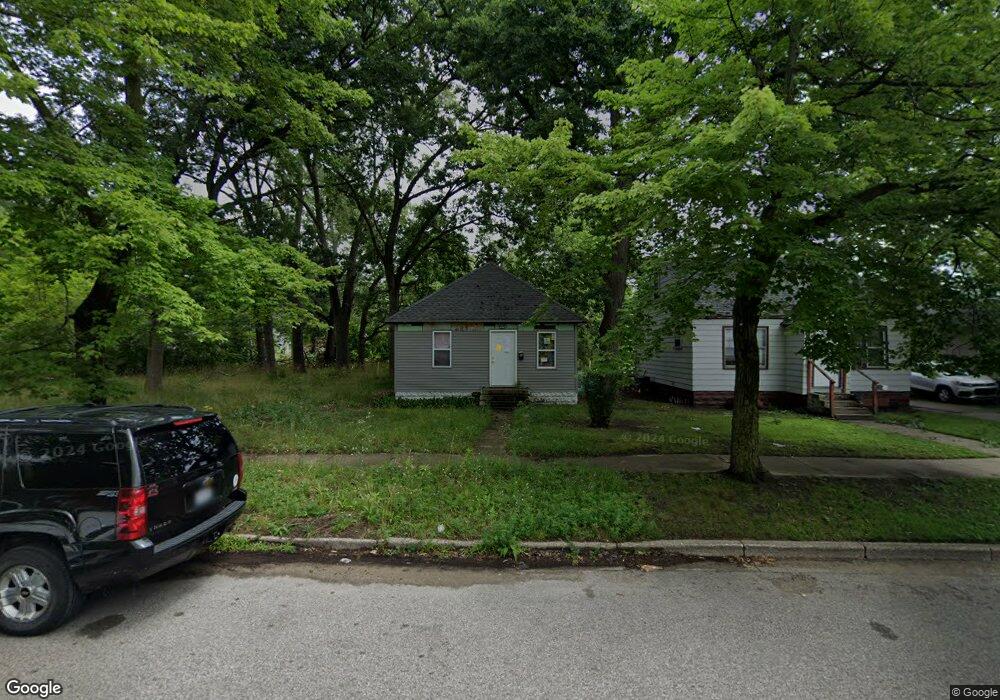
2436 Reynolds St Muskegon, MI 49444
Estimated Value: $88,521 - $99,000
2
Beds
1
Bath
1,012
Sq Ft
$93/Sq Ft
Est. Value
About This Home
This home is located at 2436 Reynolds St, Muskegon, MI 49444 and is currently estimated at $94,130, approximately $93 per square foot. 2436 Reynolds St is a home located in Muskegon County with nearby schools including Edgewood Elementary Academy, Dr. Martin Luther King Academy, and Muskegon Heights Academy.
Ownership History
Date
Name
Owned For
Owner Type
Purchase Details
Closed on
Sep 29, 2025
Sold by
Muskegon Reynolds 2436 Trust
Bought by
Taylor Clint
Current Estimated Value
Purchase Details
Closed on
Jun 26, 2023
Sold by
Lavoie Cody James
Bought by
Muskegon Reynolds 2436 Trust
Purchase Details
Closed on
Oct 14, 2014
Sold by
Stone Water Real Estate
Bought by
Manton Russell
Purchase Details
Closed on
Jun 23, 2005
Sold by
Colbert Alejandro and Colbert Monica Adams
Bought by
Roberson Amber S
Home Financials for this Owner
Home Financials are based on the most recent Mortgage that was taken out on this home.
Original Mortgage
$50,400
Interest Rate
7.9%
Mortgage Type
Fannie Mae Freddie Mac
Purchase Details
Closed on
Apr 20, 2005
Sold by
Henderson Johnnie L and Henderson Cora B
Bought by
Colbert Alejandro
Create a Home Valuation Report for This Property
The Home Valuation Report is an in-depth analysis detailing your home's value as well as a comparison with similar homes in the area
Home Values in the Area
Average Home Value in this Area
Purchase History
| Date | Buyer | Sale Price | Title Company |
|---|---|---|---|
| Taylor Clint | -- | None Listed On Document | |
| Muskegon Reynolds 2436 Trust | -- | None Listed On Document | |
| Manton Russell | $1,150 | None Available | |
| Rose David | -- | None Available | |
| Roberson Amber S | $63,000 | Muskegon Land Title Agency L | |
| Colbert Alejandro | $13,500 | Ticor Title Insurance |
Source: Public Records
Mortgage History
| Date | Status | Borrower | Loan Amount |
|---|---|---|---|
| Previous Owner | Roberson Amber S | $50,400 |
Source: Public Records
Tax History Compared to Growth
Tax History
| Year | Tax Paid | Tax Assessment Tax Assessment Total Assessment is a certain percentage of the fair market value that is determined by local assessors to be the total taxable value of land and additions on the property. | Land | Improvement |
|---|---|---|---|---|
| 2025 | $1,019 | $33,600 | $0 | $0 |
| 2024 | $755 | $29,600 | $0 | $0 |
| 2023 | $824 | $15,700 | $0 | $0 |
| 2022 | $1,113 | $14,800 | $0 | $0 |
| 2021 | $606 | $8,000 | $0 | $0 |
| 2020 | $575 | $7,800 | $0 | $0 |
| 2019 | $564 | $10,700 | $0 | $0 |
| 2018 | $551 | $9,000 | $0 | $0 |
| 2017 | $511 | $7,100 | $0 | $0 |
| 2016 | $357 | $7,300 | $0 | $0 |
| 2015 | -- | $7,500 | $0 | $0 |
| 2014 | -- | $10,400 | $0 | $0 |
| 2013 | -- | $10,100 | $0 | $0 |
Source: Public Records
Map
Nearby Homes
- 2525 Reynolds St
- 2424 Howden St
- 2529 Riordan St
- 307 E Sherman Blvd
- 2615 Wood St
- 2304 Howden St
- 2237 Wood St
- 2132 Manz St
- 2520 Sanford St
- 2202 Hoyt St
- 2521 Sanford St
- 2233 Mc Ilwraith St
- 2128 Hoyt St
- 2816 Leahy St
- 2818 Riordan St
- 556 E Barney Ave
- 2833 Hoyt St
- 2113 Hoyt St
- 2200 Peck St
- 2780 Sanford St
- 2440 Reynolds St
- 2444 Reynolds St
- 2428 Reynolds St
- 2437 Howden St
- 2424 Reynolds St
- 260 E Hume Ave
- 2429 Howden St
- 2437 Reynolds St
- 2441 Reynolds St
- 2433 Reynolds St
- 2420 Reynolds St
- 2425 Howden St
- 2445 Reynolds St
- 2429 Reynolds St
- 2500 Reynolds St
- 2425 Reynolds St
- 2421 Howden St
- 2504 Reynolds St
- 2416 Reynolds St
- 2501 Howden St