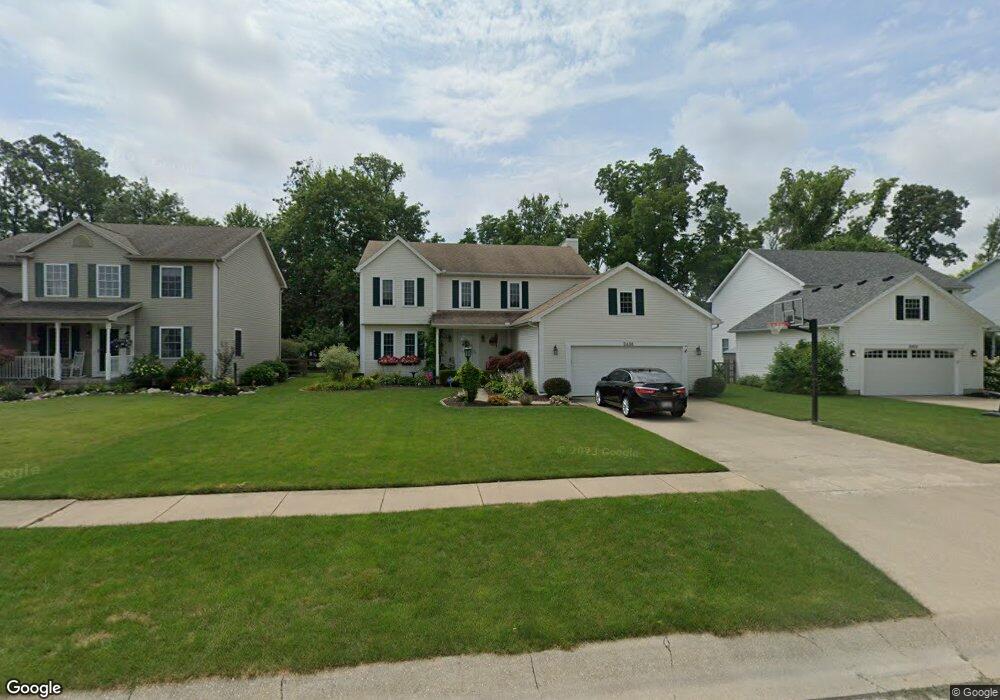
2438 Coe Ct Perrysburg, OH 43551
Estimated Value: $359,000 - $411,000
4
Beds
3
Baths
2,650
Sq Ft
$148/Sq Ft
Est. Value
About This Home
This home is located at 2438 Coe Ct, Perrysburg, OH 43551 and is currently estimated at $393,399, approximately $148 per square foot. 2438 Coe Ct is a home located in Wood County with nearby schools including Toth Elementary School, Perrysburg Junior High School, and Perrysburg High School.
Ownership History
Date
Name
Owned For
Owner Type
Purchase Details
Closed on
Jul 15, 2011
Sold by
Pekarcik Stephen and Pekarcik Konna
Bought by
Byrne Eric J and Byrne Courtney K
Current Estimated Value
Home Financials for this Owner
Home Financials are based on the most recent Mortgage that was taken out on this home.
Original Mortgage
$188,591
Outstanding Balance
$128,884
Interest Rate
4.37%
Mortgage Type
FHA
Estimated Equity
$264,515
Purchase Details
Closed on
Dec 27, 2003
Sold by
Brown Michael L and Brown Patricia J
Bought by
Pekarcik Stephen and Pekarcik Konna
Purchase Details
Closed on
Apr 22, 2000
Sold by
Moses Bradley A and Moses Kimberly L
Bought by
Brown Michael L and Brown Patricia J
Purchase Details
Closed on
Jul 14, 1997
Sold by
Dold Homes Inc
Bought by
Moses Bradley A and Moses Kimberly L
Home Financials for this Owner
Home Financials are based on the most recent Mortgage that was taken out on this home.
Original Mortgage
$137,800
Interest Rate
6.5%
Mortgage Type
New Conventional
Create a Home Valuation Report for This Property
The Home Valuation Report is an in-depth analysis detailing your home's value as well as a comparison with similar homes in the area
Home Values in the Area
Average Home Value in this Area
Purchase History
| Date | Buyer | Sale Price | Title Company |
|---|---|---|---|
| Byrne Eric J | $193,333 | Chicago Title | |
| Pekarcik Stephen | $210,500 | Midland Title | |
| Brown Michael L | $185,900 | -- | |
| Moses Bradley A | $172,315 | -- |
Source: Public Records
Mortgage History
| Date | Status | Borrower | Loan Amount |
|---|---|---|---|
| Open | Byrne Eric J | $188,591 | |
| Previous Owner | Moses Bradley A | $137,800 |
Source: Public Records
Tax History Compared to Growth
Tax History
| Year | Tax Paid | Tax Assessment Tax Assessment Total Assessment is a certain percentage of the fair market value that is determined by local assessors to be the total taxable value of land and additions on the property. | Land | Improvement |
|---|---|---|---|---|
| 2024 | $6,438 | $110,985 | $16,555 | $94,430 |
| 2023 | $6,438 | $110,990 | $16,560 | $94,430 |
| 2021 | $5,519 | $87,540 | $14,110 | $73,430 |
| 2020 | $5,602 | $87,540 | $14,110 | $73,430 |
| 2019 | $4,906 | $74,310 | $14,110 | $60,200 |
| 2018 | $4,371 | $74,310 | $14,110 | $60,200 |
| 2017 | $4,123 | $74,310 | $14,110 | $60,200 |
| 2016 | $4,053 | $66,260 | $14,810 | $51,450 |
| 2015 | $4,053 | $66,260 | $14,810 | $51,450 |
| 2014 | $4,088 | $66,260 | $14,810 | $51,450 |
| 2013 | $3,984 | $63,110 | $14,110 | $49,000 |
Source: Public Records
Map
Nearby Homes
- 0 Brookwoode Rd
- 670 Ridge Lake Ct
- 1380 Brookwoode Rd
- 11 Hawthorne Crossing
- 2837 Woods Edge Rd
- 700 Delaware Dr
- 13975 Eckel Junction Rd
- 158 Barton Creek Dr
- 168 Barton Creek Dr
- 162 Barton Creek Dr
- 142 Barton Creek Dr
- 144 Barton Creek Dr
- 140 Barton Creek Dr
- 549 Canterbury Blvd
- 2106 Ashley Ct
- 2107 Ashley Ct
- LOT 140 Canterbury Blvd
- 2062 Lexington Dr
- 116 Wellington Place
- 122 Wellington Place