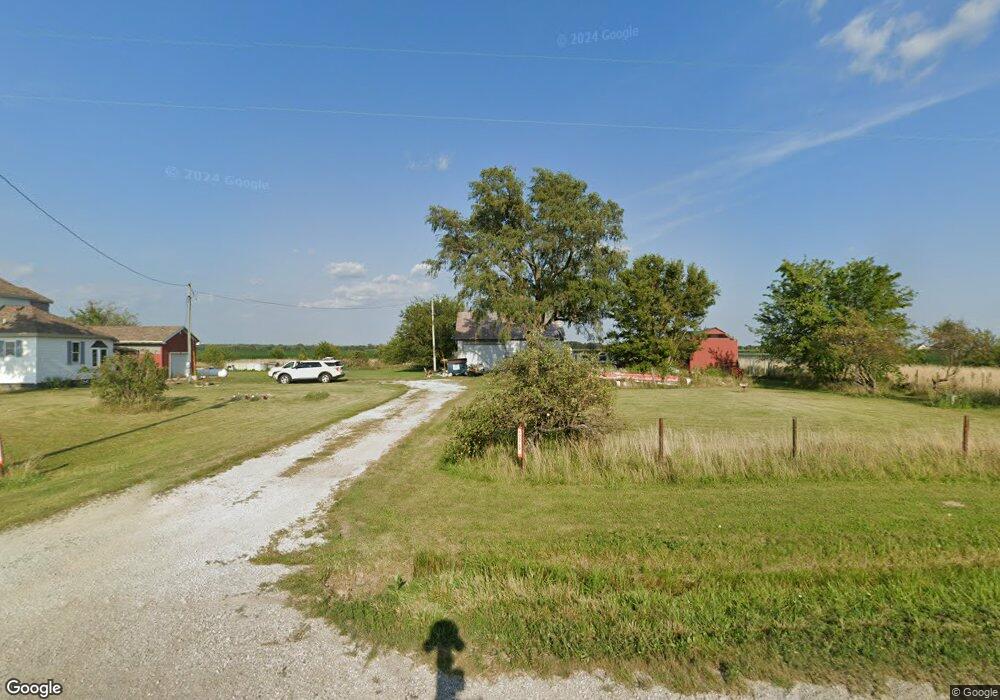
2438 N State Route 49 Ashkum, IL 60911
Estimated Value: $121,000 - $263,000
3
Beds
1
Bath
1,372
Sq Ft
$133/Sq Ft
Est. Value
About This Home
This home is located at 2438 N State Route 49, Ashkum, IL 60911 and is currently estimated at $182,358, approximately $132 per square foot. 2438 N State Route 49 is a home located in Iroquois County with nearby schools including Chebanse Elementary School, John L. Nash Middle School, and Central High School.
Ownership History
Date
Name
Owned For
Owner Type
Purchase Details
Closed on
Mar 14, 2019
Sold by
Machias Heather Mae
Bought by
Sweet William J
Current Estimated Value
Home Financials for this Owner
Home Financials are based on the most recent Mortgage that was taken out on this home.
Original Mortgage
$52,294
Outstanding Balance
$33,964
Interest Rate
4.62%
Mortgage Type
New Conventional
Estimated Equity
$148,394
Purchase Details
Closed on
Oct 18, 2010
Bought by
Rosenboom Roland
Create a Home Valuation Report for This Property
The Home Valuation Report is an in-depth analysis detailing your home's value as well as a comparison with similar homes in the area
Home Values in the Area
Average Home Value in this Area
Purchase History
| Date | Buyer | Sale Price | Title Company |
|---|---|---|---|
| Sweet William J | -- | None Available | |
| Sweet William J | $64,500 | None Available | |
| Rosenboom Roland | $50,000 | -- |
Source: Public Records
Mortgage History
| Date | Status | Borrower | Loan Amount |
|---|---|---|---|
| Open | Sweet William J | $52,294 |
Source: Public Records
Tax History Compared to Growth
Tax History
| Year | Tax Paid | Tax Assessment Tax Assessment Total Assessment is a certain percentage of the fair market value that is determined by local assessors to be the total taxable value of land and additions on the property. | Land | Improvement |
|---|---|---|---|---|
| 2024 | $2,532 | $41,230 | $11,410 | $29,820 |
| 2023 | $2,532 | $36,650 | $10,140 | $26,510 |
| 2022 | $2,267 | $35,930 | $9,940 | $25,990 |
| 2021 | $2,078 | $33,230 | $9,190 | $24,040 |
| 2020 | $1,794 | $28,500 | $7,880 | $20,620 |
| 2019 | $2,236 | $27,560 | $7,620 | $19,940 |
| 2018 | $2,168 | $26,840 | $7,420 | $19,420 |
| 2017 | $2,167 | $26,370 | $7,290 | $19,080 |
| 2016 | $2,222 | $26,370 | $7,290 | $19,080 |
| 2015 | $2,211 | $26,040 | $7,200 | $18,840 |
| 2014 | $2,211 | $25,570 | $7,070 | $18,500 |
| 2013 | $2,305 | $26,700 | $7,380 | $19,320 |
Source: Public Records
Map
Nearby Homes
- 1500 E 2400 Rd N Unit 66
- 400 S Martin St
- 133 S Oak Acre Dr
- 1340 E 2700 Rd N
- 1340 E 2700 North Rd
- 410 E Main St
- 0 County Road 2600 N
- 107 S Clinton St
- 101 S Voss Grove Dr
- 835 Illinois 116
- 255 S Fourth St
- 112 North St
- 2773 N 900 East Rd
- 601 N Church St
- 290 E 1st Ave
- 175 E 3rd Ave
- 195 W 3rd Ave
- Lake View Drive Lot Unit WP001
- 0 Lake View Dr Unit MRD12455038
- 801 Main St