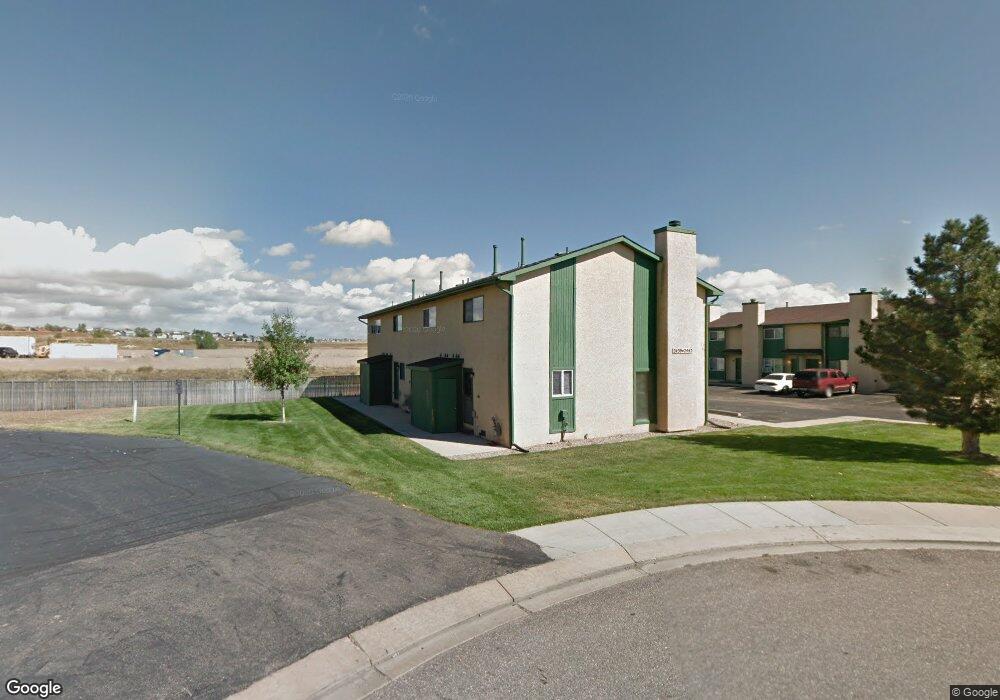
2439 Cherokee Park Place Colorado Springs, CO 80915
Estimated Value: $193,000 - $221,000
2
Beds
2
Baths
960
Sq Ft
$222/Sq Ft
Est. Value
About This Home
This home is located at 2439 Cherokee Park Place, Colorado Springs, CO 80915 and is currently estimated at $212,698, approximately $221 per square foot. 2439 Cherokee Park Place is a home located in El Paso County with nearby schools including Evans International Elementary School, Horizon Middle School, and Sand Creek High School.
Ownership History
Date
Name
Owned For
Owner Type
Purchase Details
Closed on
Mar 7, 2024
Sold by
Jones Gregory D and Jones Tammy G
Bought by
Gregory D Jones Trust and Tammy G Jones Trust
Current Estimated Value
Purchase Details
Closed on
Sep 15, 2023
Sold by
Carl J Slawski Living Trust
Bought by
Jones Gregory D and Jones Tammy G
Home Financials for this Owner
Home Financials are based on the most recent Mortgage that was taken out on this home.
Original Mortgage
$157,500
Interest Rate
6.96%
Mortgage Type
New Conventional
Purchase Details
Closed on
Feb 26, 1999
Sold by
Carl Slawski
Bought by
Slawski Carl J and The Carl J Slawski Living Trust
Purchase Details
Closed on
May 13, 1991
Bought by
Slawski Carl J Trustee
Purchase Details
Closed on
Jan 23, 1991
Bought by
Slawski Carl J Trustee
Purchase Details
Closed on
Jun 1, 1987
Bought by
Slawski Carl J Trustee
Purchase Details
Closed on
Nov 1, 1986
Bought by
Slawski Carl J Living Trust
Create a Home Valuation Report for This Property
The Home Valuation Report is an in-depth analysis detailing your home's value as well as a comparison with similar homes in the area
Home Values in the Area
Average Home Value in this Area
Purchase History
| Date | Buyer | Sale Price | Title Company |
|---|---|---|---|
| Gregory D Jones Trust | -- | None Listed On Document | |
| Jones Gregory D | $210,000 | Capital Title | |
| Slawski Carl J | -- | -- | |
| Slawski Carl J Trustee | $23,500 | -- | |
| Slawski Carl J Trustee | $25,000 | -- | |
| Slawski Carl J Trustee | -- | -- | |
| Slawski Carl J Living Trust | -- | -- |
Source: Public Records
Mortgage History
| Date | Status | Borrower | Loan Amount |
|---|---|---|---|
| Previous Owner | Jones Gregory D | $157,500 |
Source: Public Records
Tax History Compared to Growth
Tax History
| Year | Tax Paid | Tax Assessment Tax Assessment Total Assessment is a certain percentage of the fair market value that is determined by local assessors to be the total taxable value of land and additions on the property. | Land | Improvement |
|---|---|---|---|---|
| 2025 | $876 | $16,910 | -- | -- |
| 2024 | $774 | $16,230 | $3,350 | $12,880 |
| 2023 | $774 | $16,230 | $3,350 | $12,880 |
| 2022 | $681 | $9,720 | $2,090 | $7,630 |
| 2021 | $705 | $10,000 | $2,150 | $7,850 |
| 2020 | $597 | $8,430 | $1,290 | $7,140 |
| 2019 | $591 | $8,430 | $1,290 | $7,140 |
| 2018 | $473 | $6,630 | $1,010 | $5,620 |
| 2017 | $475 | $6,630 | $1,010 | $5,620 |
| 2016 | $445 | $6,220 | $960 | $5,260 |
| 2015 | $446 | $6,220 | $960 | $5,260 |
| 2014 | $386 | $5,300 | $800 | $4,500 |
Source: Public Records
Map
Nearby Homes
- 2477 Vanhoutte View
- 2434 Cherokee Park Place
- 2405 Washo Cir
- 2447 Vanhoutte View
- 7253 Rosa Belle Heights
- 2486 Serviceberry Grove
- 2441 Vanhoutte View
- 2435 Vanhoutte View
- 2451 Horsemanship Ct
- 7275 Hunter Jumper Dr
- 2481 Horsemanship Ct
- 2467 Zorro Heights
- 2518 Grand Prix Ct
- Boston Plan at Urban Collection at Palmer Village
- Chicago Plan at Urban Collection at Palmer Village
- 2453 Vanhoutte View
- 2429 Vanhoutte View
- 7515 Fountain Grass Grove
- 2556 Hannah Ridge Dr
- 2598 Hannah Ridge Dr
- 2441 Cherokee Park Place
- 2443 Cherokee Park Place
- 2445 Cherokee Park Place
- 2447 Cherokee Park Place
- 2449 Cherokee Park Place
- 2451 Cherokee Park Place
- 2431 Cherokee Park Place
- 2433 Cherokee Park Place
- 2435 Cherokee Park Place
- 2453 Cherokee Park Place
- 2437 Cherokee Park Place
- 2422 Cherokee Park Place
- 2429 Cherokee Park Place
- 2420 Cherokee Park Place
- 2438 Cherokee Park Place
- 2427 Cherokee Park Place
- 2418 Cherokee Park Place
- 2436 Cherokee Park Place
- 2457 Shawnee Dr
- 2425 Cherokee Park Place