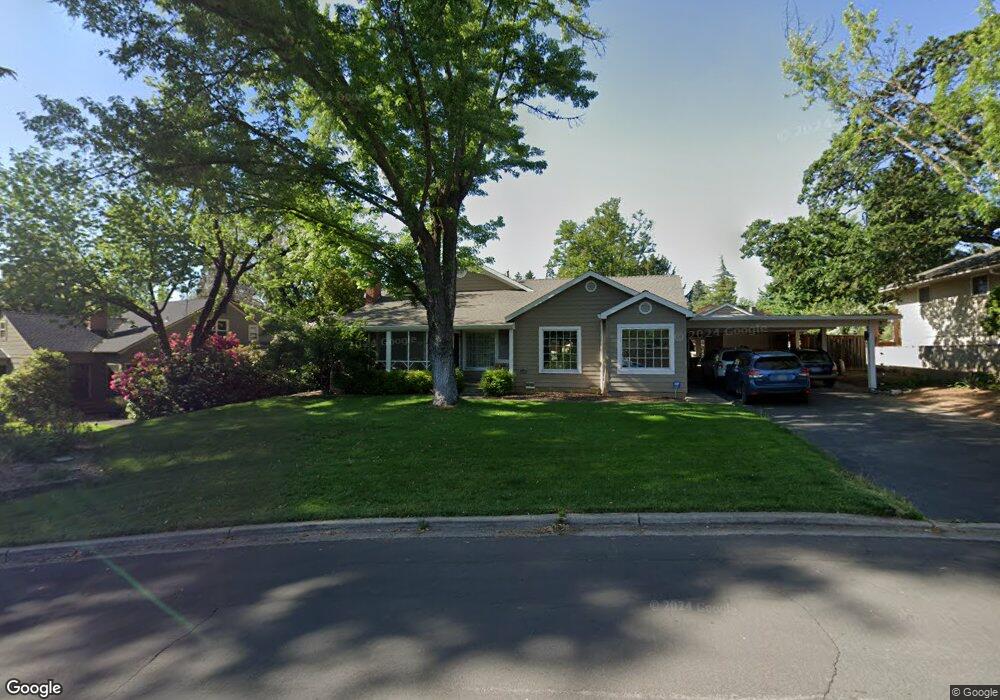
2439 Lyman Ave Medford, OR 97504
Estimated Value: $478,000 - $662,000
2
Beds
2
Baths
1,790
Sq Ft
$338/Sq Ft
Est. Value
About This Home
This home is located at 2439 Lyman Ave, Medford, OR 97504 and is currently estimated at $605,336, approximately $338 per square foot. 2439 Lyman Ave is a home located in Jackson County with nearby schools including Lone Pine Elementary School, Hedrick Middle School, and North Medford High School.
Ownership History
Date
Name
Owned For
Owner Type
Purchase Details
Closed on
Feb 6, 2012
Sold by
Greidanus Roger J and Greidanus Kathleen M
Bought by
Greidanus Roger and Greidanus Kathy
Current Estimated Value
Home Financials for this Owner
Home Financials are based on the most recent Mortgage that was taken out on this home.
Original Mortgage
$255,000
Outstanding Balance
$174,785
Interest Rate
3.9%
Mortgage Type
New Conventional
Estimated Equity
$430,551
Purchase Details
Closed on
Sep 5, 2008
Sold by
Greidanus Roger J and Greidanus Kathleen M
Bought by
Greidanus Roger and Greidanus Kathy
Purchase Details
Closed on
May 14, 2001
Sold by
Bennett Kenneth R and Bennett Frances A
Bought by
Greidanus Roger J and Greidanus Kathleen M
Home Financials for this Owner
Home Financials are based on the most recent Mortgage that was taken out on this home.
Original Mortgage
$143,100
Interest Rate
7.03%
Create a Home Valuation Report for This Property
The Home Valuation Report is an in-depth analysis detailing your home's value as well as a comparison with similar homes in the area
Home Values in the Area
Average Home Value in this Area
Purchase History
| Date | Buyer | Sale Price | Title Company |
|---|---|---|---|
| Greidanus Roger | -- | Ticor Title | |
| Greidanus Roger J | -- | Ticor Title | |
| Greidanus Roger | -- | None Available | |
| Greidanus Roger J | $178,900 | Crater Title Insurance |
Source: Public Records
Mortgage History
| Date | Status | Borrower | Loan Amount |
|---|---|---|---|
| Open | Greidanus Roger J | $255,000 | |
| Closed | Greidanus Roger J | $143,100 |
Source: Public Records
Tax History Compared to Growth
Tax History
| Year | Tax Paid | Tax Assessment Tax Assessment Total Assessment is a certain percentage of the fair market value that is determined by local assessors to be the total taxable value of land and additions on the property. | Land | Improvement |
|---|---|---|---|---|
| 2025 | $4,538 | $312,890 | $87,010 | $225,880 |
| 2024 | $4,538 | $303,780 | $84,470 | $219,310 |
| 2023 | $4,399 | $294,940 | $82,010 | $212,930 |
| 2022 | $4,291 | $294,940 | $82,010 | $212,930 |
| 2021 | $4,180 | $286,350 | $79,620 | $206,730 |
| 2020 | $4,092 | $278,010 | $77,300 | $200,710 |
| 2019 | $3,995 | $262,060 | $72,880 | $189,180 |
| 2018 | $3,893 | $254,430 | $70,760 | $183,670 |
| 2017 | $3,823 | $254,430 | $70,760 | $183,670 |
| 2016 | $3,848 | $239,830 | $66,700 | $173,130 |
| 2015 | $3,699 | $239,830 | $66,700 | $173,130 |
| 2014 | $3,633 | $226,070 | $62,870 | $163,200 |
Source: Public Records
Map
Nearby Homes
- 109 Kensington Square
- 91 Black Oak Dr
- 721 Brookdale Ave
- 164 Black Oak Dr
- 2020 Ridge Way
- 101 S Modoc Ave
- 740 N Modoc Ave
- 2233 Oakwood Dr
- 889 Valley View Dr
- 1925 Stratford Ave
- 312 N Barneburg Rd
- 305 S Groveland Ave
- 1711 E Main St
- 1560 Cambridge Cir
- 1137 Riverrock Way
- 325 Sutter Ave
- 1744 Carrera Cir
- 1277 Gardendale Ave
- 1258 Paulita Dr
- 2556 Dellwood Ave
- 2447 Lyman Ave
- 2435 Lyman Ave
- 2508 E Jackson Dr
- 2595 E Jackson Dr
- 2427 Lyman Ave
- 201 Girard Dr
- 2416 Lyman Ave
- 2451 Lyman Ave
- 112 Scheffel Ave
- 207 Bradford Way
- 205 Girard Dr
- 2415 Lyman Ave
- 214 Girard Dr
- 2501 Lyman Ave
- 140 Kensington Square
- 2502 Jackson Dr
- 2447 Hillcrest Rd
- 132 Kensington Square
- 204 Bradford Way
- 209 Girard Dr