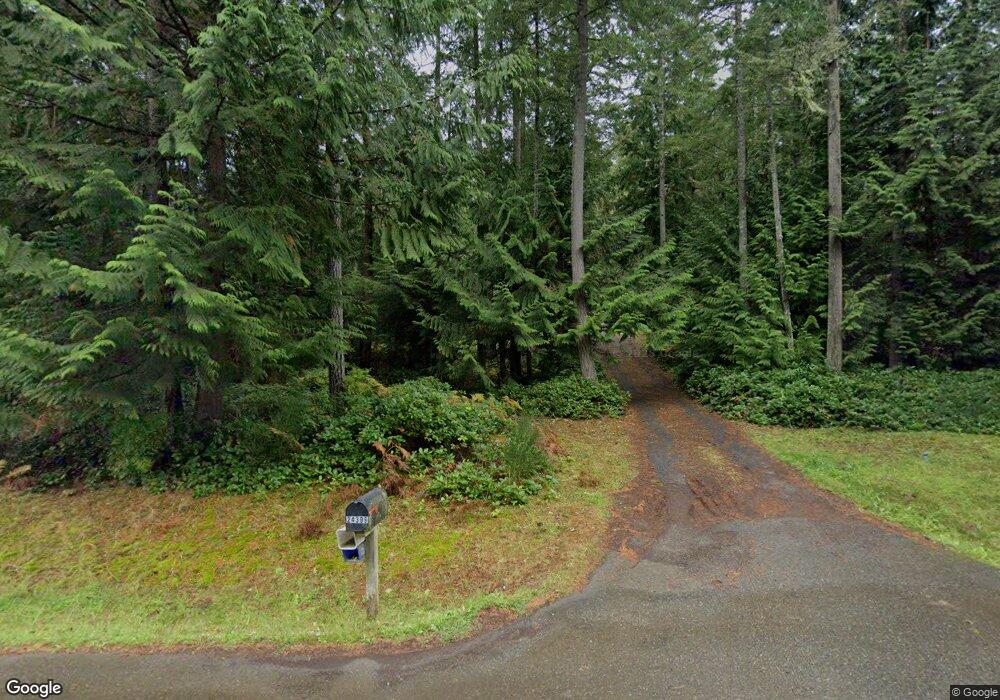
24399 Gracey Trail Ln NE Poulsbo, WA 98370
Estimated Value: $754,350 - $799,000
4
Beds
3
Baths
2,292
Sq Ft
$337/Sq Ft
Est. Value
About This Home
This home is located at 24399 Gracey Trail Ln NE, Poulsbo, WA 98370 and is currently estimated at $771,838, approximately $336 per square foot. 24399 Gracey Trail Ln NE is a home located in Kitsap County with nearby schools including David Wolfle Elementary School, Kingston Middle School, and Kingston High School.
Ownership History
Date
Name
Owned For
Owner Type
Purchase Details
Closed on
Sep 3, 2002
Sold by
Cundiff Deborah E
Bought by
Herzog Philip L and Herzog Lois C
Current Estimated Value
Home Financials for this Owner
Home Financials are based on the most recent Mortgage that was taken out on this home.
Original Mortgage
$196,000
Outstanding Balance
$82,175
Interest Rate
6.29%
Estimated Equity
$689,663
Purchase Details
Closed on
Nov 17, 2000
Sold by
North Pacific Homes Inc
Bought by
Cundiff Deborah E
Home Financials for this Owner
Home Financials are based on the most recent Mortgage that was taken out on this home.
Original Mortgage
$202,500
Interest Rate
7.82%
Purchase Details
Closed on
Apr 11, 2000
Sold by
North Pacific Development Corp
Bought by
North Pacific Homes Inc
Purchase Details
Closed on
Mar 11, 1998
Sold by
North Pacific Development Corp
Bought by
North Pacific Homes Inc
Create a Home Valuation Report for This Property
The Home Valuation Report is an in-depth analysis detailing your home's value as well as a comparison with similar homes in the area
Home Values in the Area
Average Home Value in this Area
Purchase History
| Date | Buyer | Sale Price | Title Company |
|---|---|---|---|
| Herzog Philip L | $245,000 | Transnation Title Insurance | |
| Cundiff Deborah E | $225,000 | Pacific Nw Title | |
| North Pacific Homes Inc | -- | Pacific Northwest Title | |
| North Pacific Homes Inc | -- | -- |
Source: Public Records
Mortgage History
| Date | Status | Borrower | Loan Amount |
|---|---|---|---|
| Open | Herzog Philip L | $196,000 | |
| Previous Owner | Cundiff Deborah E | $202,500 |
Source: Public Records
Tax History Compared to Growth
Tax History
| Year | Tax Paid | Tax Assessment Tax Assessment Total Assessment is a certain percentage of the fair market value that is determined by local assessors to be the total taxable value of land and additions on the property. | Land | Improvement |
|---|---|---|---|---|
| 2026 | $6,065 | $683,670 | $155,210 | $528,460 |
| 2025 | $6,065 | $683,670 | $155,210 | $528,460 |
| 2024 | $5,675 | $660,320 | $135,230 | $525,090 |
| 2023 | $5,767 | $660,320 | $135,230 | $525,090 |
| 2022 | $4,804 | $520,850 | $112,690 | $408,160 |
| 2021 | $4,494 | $450,090 | $97,090 | $353,000 |
| 2020 | $4,361 | $430,320 | $92,760 | $337,560 |
| 2019 | $4,089 | $402,190 | $86,690 | $315,500 |
| 2018 | $3,833 | $319,590 | $86,690 | $232,900 |
| 2017 | $3,645 | $319,590 | $86,690 | $232,900 |
| 2016 | $3,516 | $283,600 | $86,690 | $196,910 |
| 2015 | $3,492 | $283,600 | $86,690 | $196,910 |
| 2014 | -- | $272,760 | $86,690 | $186,070 |
| 2013 | -- | $272,760 | $86,690 | $186,070 |
Source: Public Records
Map
Nearby Homes
- 28005 Trillium Ln NE
- 4493 NE Stevens Uhler Rd
- 4457 NE Stevens Uhler Rd
- 24165 Port Gamble Rd NE
- 0 NE Sawdust Hill Rd Unit NWM2446451
- 0 Old Military Rd NE Unit NWM2389849
- 6353 NE Gratitude Way
- 4762 Tree Ridge Ln NE
- 4708 Tree Ridge Ln NE
- 0 xxx Big Valley Rd
- 27442 State Highway 104 NE
- 27582 State Highway 104 NE
- 6106 NE State Highway 104
- 5655 NE Grove Ln
- 27272 Big Valley Rd NE
- 0 XXX Sanderling Place NE
- 0 State Hwy 3 NE Unit NWM2410405
- 28xxx NE State Hwy 104
- 123 Pugh Rd NE
- 0 Bond Rd NE
- 24393 Gracey Trail Ln NE
- 24405 Gracey Trail Ln NE
- 24387 Gracey Trail Ln NE
- 0 LOT 3 Gracey Trail Ln NE
- 0 LOT 4 Gracey Trail Ln NE
- 24411 Gracey Trail Ln NE
- 24381 Gracey Trail Ln NE
- 24392 Gracey Trail Ln NE
- 37 NE Snowhill Ln
- 24355 Stottlemeyer Rd NE
- 0 NE Snowhill Ln
- 24380 Gracey Trail Ln NE
- 24404 Gracey Trail Ln NE
- 24337 Stottlemeyer Rd NE
- 24416 Gracey Trail Ln NE
- 24239 NE Snowhill Ln
- 24244 NE Snowhill Ln
- 24244 NE Snowhill Ln
- 24319 Stottlemeyer Rd NE
- 24899 Stottlemeyer Rd NE