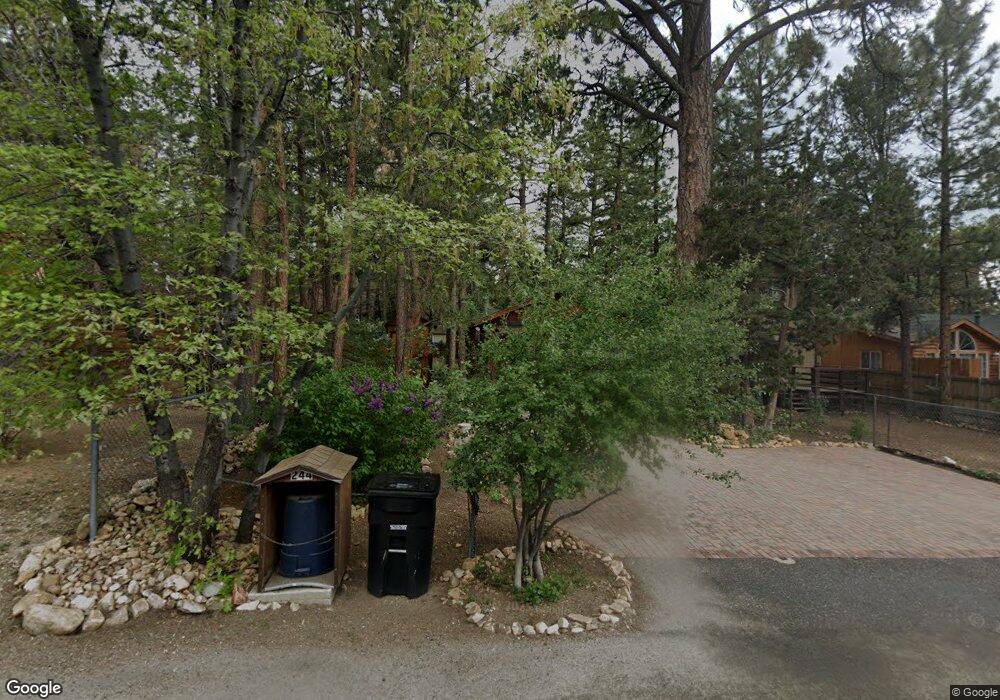
244 Cedar Ln Sugarloaf, CA 92386
Estimated Value: $244,378 - $303,000
2
Beds
1
Bath
780
Sq Ft
$346/Sq Ft
Est. Value
About This Home
This home is located at 244 Cedar Ln, Sugarloaf, CA 92386 and is currently estimated at $270,095, approximately $346 per square foot. 244 Cedar Ln is a home with nearby schools including Baldwin Lane Elementary School, Big Bear Middle School, and Big Bear High School.
Ownership History
Date
Name
Owned For
Owner Type
Purchase Details
Closed on
Aug 27, 2015
Sold by
Christensen Inge Elgaard
Bought by
Famil Christensen Inge Elgaard
Current Estimated Value
Purchase Details
Closed on
Jan 26, 2006
Sold by
Dechiro Judy A
Bought by
Famil Christensen Inge Elgaard
Purchase Details
Closed on
Nov 21, 2005
Sold by
Christensen Paul R
Bought by
Famil Christensen Inge Elgaard
Purchase Details
Closed on
Jul 21, 2000
Sold by
Christensen Inge Elgaard
Bought by
Famil Christensen Inge Elgaard
Create a Home Valuation Report for This Property
The Home Valuation Report is an in-depth analysis detailing your home's value as well as a comparison with similar homes in the area
Home Values in the Area
Average Home Value in this Area
Purchase History
| Date | Buyer | Sale Price | Title Company |
|---|---|---|---|
| Famil Christensen Inge Elgaard | -- | None Available | |
| Famil Christensen Inge Elgaard | -- | None Available | |
| Famil Christensen Inge Elgaard | -- | None Available | |
| Famil Christensen Inge Elgaard | -- | -- |
Source: Public Records
Tax History
| Year | Tax Paid | Tax Assessment Tax Assessment Total Assessment is a certain percentage of the fair market value that is determined by local assessors to be the total taxable value of land and additions on the property. | Land | Improvement |
|---|---|---|---|---|
| 2025 | $2,086 | $74,692 | $9,224 | $65,468 |
| 2024 | $1,973 | $73,227 | $9,043 | $64,184 |
| 2023 | $1,883 | $71,791 | $8,866 | $62,925 |
| 2022 | $1,786 | $70,383 | $8,692 | $61,691 |
| 2021 | $1,735 | $69,003 | $8,522 | $60,481 |
| 2020 | $1,708 | $68,296 | $8,435 | $59,861 |
| 2019 | $1,668 | $66,957 | $8,270 | $58,687 |
| 2018 | $1,600 | $65,644 | $8,108 | $57,536 |
| 2017 | $1,547 | $64,357 | $7,949 | $56,408 |
| 2016 | $1,503 | $63,095 | $7,793 | $55,302 |
| 2015 | $1,544 | $62,147 | $7,676 | $54,471 |
| 2014 | $1,513 | $60,930 | $7,526 | $53,404 |
Source: Public Records
Map
Nearby Homes
Your Personal Tour Guide
Ask me questions while you tour the home.