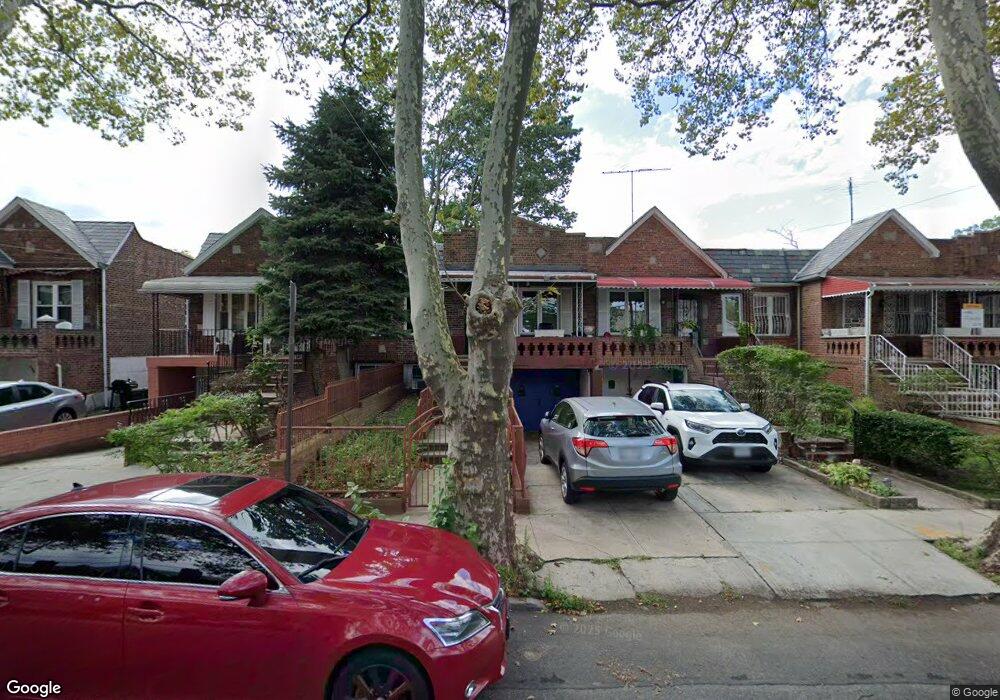
244 E 48th St Brooklyn, NY 11203
East Flatbush NeighborhoodEstimated Value: $719,622 - $809,000
Studio
2
Baths
1,725
Sq Ft
$437/Sq Ft
Est. Value
About This Home
This home is located at 244 E 48th St, Brooklyn, NY 11203 and is currently estimated at $753,906, approximately $437 per square foot. 244 E 48th St is a home located in Kings County with nearby schools including Ps 135 Sheldon A Brookner, East Flatbush Community Research School, and Kings Elementary School.
Ownership History
Date
Name
Owned For
Owner Type
Purchase Details
Closed on
Oct 10, 2018
Sold by
Estate Of Eileen Graham and Estate Of Shirley P Anderson
Bought by
Tony-Jean Beatrice
Current Estimated Value
Home Financials for this Owner
Home Financials are based on the most recent Mortgage that was taken out on this home.
Original Mortgage
$275,315
Outstanding Balance
$239,100
Interest Rate
4.5%
Mortgage Type
New Conventional
Estimated Equity
$514,806
Purchase Details
Closed on
May 19, 2006
Sold by
Churchill Homes Llc
Bought by
Better Homes Depot Inc
Purchase Details
Closed on
May 16, 2006
Sold by
Pryor Edmond J and As Referee
Bought by
Churchill Homes Llc
Purchase Details
Closed on
Jul 22, 2005
Sold by
Graham Eileen and Graham Hazel
Bought by
Anderson Shirley and Graham Eileen
Create a Home Valuation Report for This Property
The Home Valuation Report is an in-depth analysis detailing your home's value as well as a comparison with similar homes in the area
Home Values in the Area
Average Home Value in this Area
Purchase History
| Date | Buyer | Sale Price | Title Company |
|---|---|---|---|
| Tony-Jean Beatrice | $525,000 | -- | |
| Tony-Jean Beatrice | $525,000 | -- | |
| Tony-Jean Beatrice | $525,000 | -- | |
| Better Homes Depot Inc | -- | -- | |
| Better Homes Depot Inc | -- | -- | |
| Churchill Homes Llc | $302,500 | -- | |
| Churchill Homes Llc | $302,500 | -- | |
| Anderson Shirley | -- | -- | |
| Anderson Shirley | -- | -- |
Source: Public Records
Mortgage History
| Date | Status | Borrower | Loan Amount |
|---|---|---|---|
| Open | Tony-Jean Beatrice | $275,315 | |
| Closed | Tony-Jean Beatrice | $275,315 |
Source: Public Records
Tax History
| Year | Tax Paid | Tax Assessment Tax Assessment Total Assessment is a certain percentage of the fair market value that is determined by local assessors to be the total taxable value of land and additions on the property. | Land | Improvement |
|---|---|---|---|---|
| 2025 | $5,906 | $43,320 | $13,620 | $29,700 |
| 2024 | $5,906 | $39,360 | $13,620 | $25,740 |
| 2023 | $5,618 | $43,380 | $13,620 | $29,760 |
| 2022 | $5,515 | $39,660 | $13,620 | $26,040 |
| 2021 | $5,538 | $37,920 | $13,620 | $24,300 |
| 2020 | $2,994 | $36,960 | $13,620 | $23,340 |
| 2019 | $5,077 | $36,960 | $13,620 | $23,340 |
| 2018 | $4,639 | $24,218 | $9,561 | $14,657 |
| 2017 | $4,637 | $24,218 | $12,109 | $12,109 |
| 2016 | $4,308 | $23,100 | $13,620 | $9,480 |
| 2015 | $2,536 | $22,674 | $12,641 | $10,033 |
| 2014 | $2,536 | $21,392 | $12,990 | $8,402 |
Source: Public Records
Map
Nearby Homes
- 303 E 48th St
- 791 Schenectady Ave
- 317 E 49th St Unit 2
- 660 Utica Ave
- 750 Troy Ave
- 628 Linden Blvd
- 625 Lenox Rd
- 828 Lenox Rd
- 380 E 48th St
- 197 E 52nd St
- 783 Linden Blvd
- 385 E 46th St
- 40 E 43rd St Unit 4H
- 40 E 43rd St Unit 2K
- 390 E 49th St
- 10 E 43rd St Unit 4K
- 10 E 43rd St Unit 5e
- 10 E 43rd St Unit 4J
- 343 E 51st St
- 400 E 49th St
- 244 E 48th St
- 244 E 48th St
- 244 E 48th St
- 244 E 48th St
- 244 E 48th St
- 248 E 48 Th St Unit 2
- 242 E 48th St
- 248 E 48th St
- 248 E 48th St Unit 2
- 248 E 48th St Unit 2F
- 240 E 48th St
- 252 E 48th St
- 236 E 48th St
- 254 E 48th St
- 234 E 48th St
- 256 E 48th St
- 711 Schenectady Ave
- 709 Schenectady Ave
- 709 Schenectady Ave Unit Building
- 715 Schenectady Ave
Your Personal Tour Guide
Ask me questions while you tour the home.