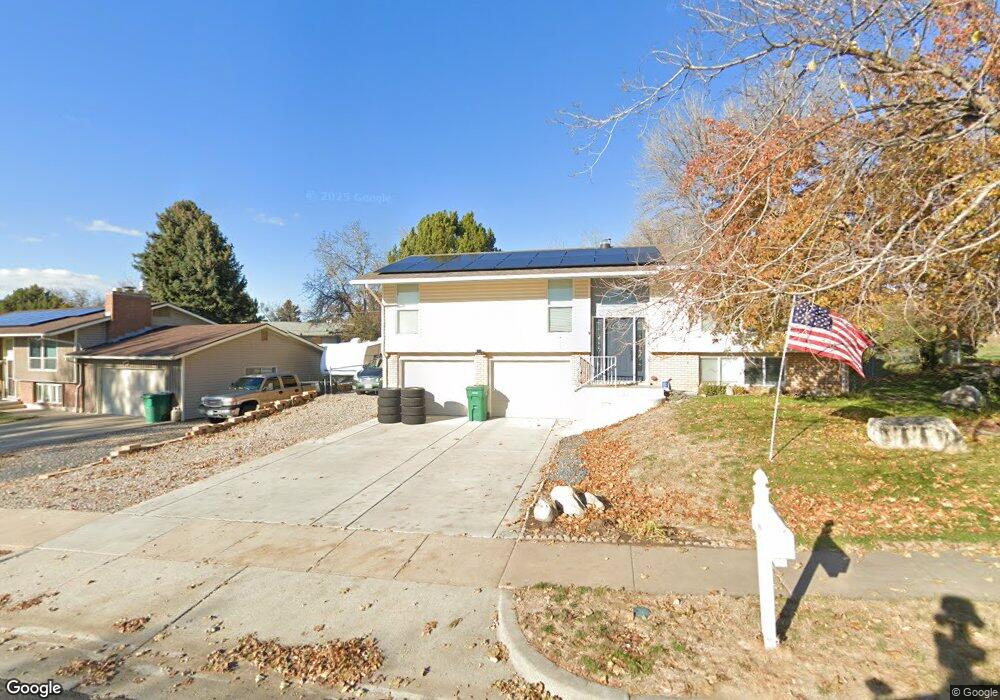
244 N 1300 E Layton, UT 84040
Estimated Value: $481,000 - $504,000
4
Beds
4
Baths
1,966
Sq Ft
$250/Sq Ft
Est. Value
About This Home
This home is located at 244 N 1300 E, Layton, UT 84040 and is currently estimated at $492,407, approximately $250 per square foot. 244 N 1300 E is a home located in Davis County with nearby schools including Whitesides Elementary School, Central Davis Junior High School, and Layton High School.
Ownership History
Date
Name
Owned For
Owner Type
Purchase Details
Closed on
Jan 22, 2021
Sold by
Carter Pamela and Kittner Pamela J
Bought by
Kapp Joseph and Kapp Lindsey
Current Estimated Value
Home Financials for this Owner
Home Financials are based on the most recent Mortgage that was taken out on this home.
Original Mortgage
$304,000
Outstanding Balance
$270,794
Interest Rate
2.6%
Mortgage Type
New Conventional
Estimated Equity
$221,613
Purchase Details
Closed on
Nov 7, 2000
Sold by
Kittner Charles Anthony and Kittner Pamela J
Bought by
Kittner Pamela J
Purchase Details
Closed on
Feb 27, 1998
Sold by
Poston Evan H
Bought by
Kittner Charles Anthony and Kittner Pamela J
Home Financials for this Owner
Home Financials are based on the most recent Mortgage that was taken out on this home.
Original Mortgage
$124,000
Interest Rate
6.9%
Mortgage Type
VA
Create a Home Valuation Report for This Property
The Home Valuation Report is an in-depth analysis detailing your home's value as well as a comparison with similar homes in the area
Home Values in the Area
Average Home Value in this Area
Purchase History
| Date | Buyer | Sale Price | Title Company |
|---|---|---|---|
| Kapp Joseph | -- | Stewart Title Insurance | |
| Kittner Pamela J | -- | -- | |
| Kittner Charles Anthony | -- | Associated Title Company |
Source: Public Records
Mortgage History
| Date | Status | Borrower | Loan Amount |
|---|---|---|---|
| Open | Kapp Joseph | $304,000 | |
| Previous Owner | Kittner Charles Anthony | $124,000 |
Source: Public Records
Tax History
| Year | Tax Paid | Tax Assessment Tax Assessment Total Assessment is a certain percentage of the fair market value that is determined by local assessors to be the total taxable value of land and additions on the property. | Land | Improvement |
|---|---|---|---|---|
| 2025 | $2,211 | $232,100 | $138,433 | $93,667 |
| 2024 | $2,117 | $223,850 | $159,664 | $64,186 |
| 2023 | $2,125 | $396,000 | $209,926 | $186,074 |
| 2022 | $2,190 | $221,650 | $113,069 | $108,581 |
| 2021 | $2,100 | $317,000 | $172,828 | $144,172 |
| 2020 | $1,127 | $262,000 | $142,945 | $119,055 |
| 2019 | $1,093 | $252,000 | $127,040 | $124,960 |
| 2018 | $950 | $230,000 | $101,265 | $128,735 |
| 2016 | $821 | $110,990 | $52,801 | $58,189 |
| 2015 | $1,506 | $105,050 | $52,801 | $52,249 |
| 2014 | $693 | $99,084 | $52,801 | $46,283 |
| 2013 | -- | $100,743 | $23,521 | $77,222 |
Source: Public Records
Map
Nearby Homes
- 1515 E Gentile St
- 479 N 1375 E
- 1503 E 530 N
- 1690 E Gentile St
- 187 N Talbot Dr
- 508 N Adamswood Rd
- 556 N Fairfield Rd Unit A2
- 556 N Fairfield Rd Unit D1
- 556 N Fairfield Rd Unit D2
- 556 N Fairfield Rd Unit A3
- 556 N Fairfield Rd Unit D3
- 556 N Fairfield Rd Unit D4
- 556 N Fairfield Rd Unit A1
- 556 N Fairfield Rd Unit A4
- 1137 Holmes Creek Ln
- 861 E 575 N
- 1033 E 825 N
- 1368 E 275 S
- 997 E 825 N
- 1545 E 975 N
Your Personal Tour Guide
Ask me questions while you tour the home.