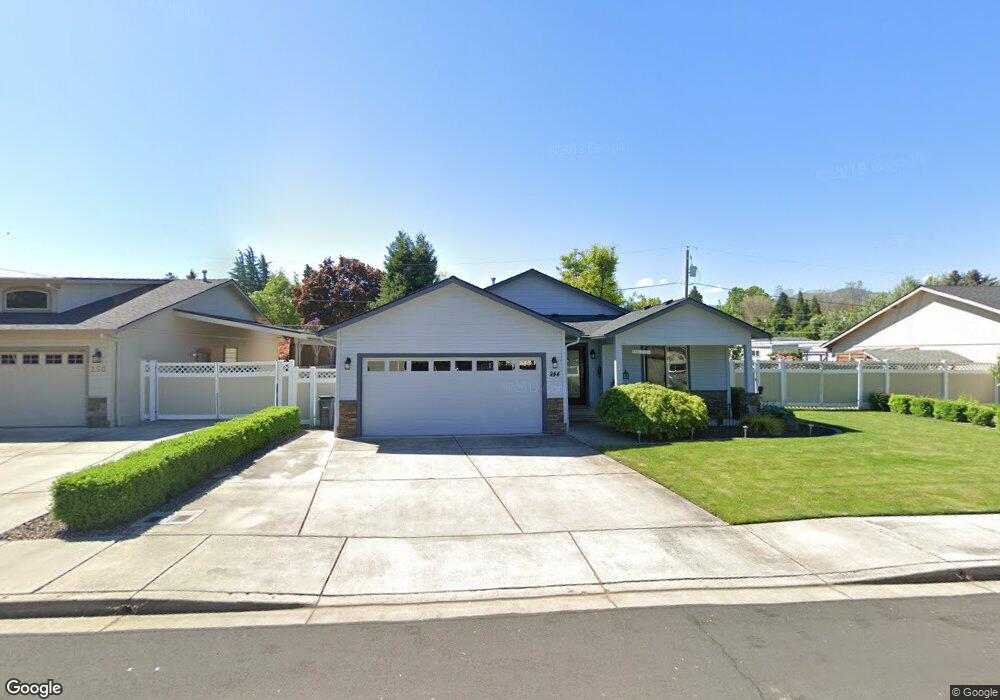
244 Oak Crest Way Medford, OR 97501
Estimated Value: $380,538 - $447,000
3
Beds
2
Baths
1,433
Sq Ft
$293/Sq Ft
Est. Value
About This Home
This home is located at 244 Oak Crest Way, Medford, OR 97501 and is currently estimated at $420,135, approximately $293 per square foot. 244 Oak Crest Way is a home located in Jackson County with nearby schools including Orchard Hill Elementary School, Talent Middle School, and Phoenix High School.
Ownership History
Date
Name
Owned For
Owner Type
Purchase Details
Closed on
May 26, 2011
Sold by
Davis Peter Howard and Schabel Kathleen Ann Davis
Bought by
Abbott Thomas R and Abbott Sherry
Current Estimated Value
Home Financials for this Owner
Home Financials are based on the most recent Mortgage that was taken out on this home.
Original Mortgage
$25,000
Outstanding Balance
$1,641
Interest Rate
4.04%
Mortgage Type
New Conventional
Estimated Equity
$418,494
Purchase Details
Closed on
Jun 30, 2006
Sold by
Davis Peter H and Schabel Kathleen Davis
Bought by
Davis Peter Howard and Schabel Kathleen Ann Davis
Purchase Details
Closed on
Sep 21, 2004
Sold by
Mt Valley Assoc Llc
Bought by
Davis Peter H and Schabel Kathleen Davis
Purchase Details
Closed on
May 4, 2004
Sold by
Medford Homes Inc
Bought by
Mt Valley Assoc Llc
Create a Home Valuation Report for This Property
The Home Valuation Report is an in-depth analysis detailing your home's value as well as a comparison with similar homes in the area
Home Values in the Area
Average Home Value in this Area
Purchase History
| Date | Buyer | Sale Price | Title Company |
|---|---|---|---|
| Abbott Thomas R | $149,900 | Ticor Title | |
| Davis Peter Howard | -- | None Available | |
| Davis Peter H | $197,125 | Lawyers Title Ins | |
| Mt Valley Assoc Llc | $70,000 | Lawyers Title Ins |
Source: Public Records
Mortgage History
| Date | Status | Borrower | Loan Amount |
|---|---|---|---|
| Open | Abbott Thomas R | $25,000 |
Source: Public Records
Tax History Compared to Growth
Tax History
| Year | Tax Paid | Tax Assessment Tax Assessment Total Assessment is a certain percentage of the fair market value that is determined by local assessors to be the total taxable value of land and additions on the property. | Land | Improvement |
|---|---|---|---|---|
| 2025 | $2,722 | $256,740 | $85,190 | $171,550 |
| 2024 | $2,722 | $249,270 | $82,710 | $166,560 |
| 2023 | $2,634 | $242,010 | $80,300 | $161,710 |
| 2022 | $2,567 | $242,010 | $80,300 | $161,710 |
| 2021 | $642 | $77,970 | $77,970 | $0 |
| 2020 | $2,082 | $198,890 | $71,190 | $127,700 |
| 2019 | $2,029 | $187,480 | $67,090 | $120,390 |
| 2018 | $2,231 | $182,020 | $65,140 | $116,880 |
| 2017 | $2,088 | $182,020 | $65,140 | $116,880 |
| 2016 | $2,033 | $171,580 | $61,400 | $110,180 |
| 2015 | $1,946 | $171,580 | $53,880 | $117,700 |
| 2014 | -- | $161,740 | $50,790 | $110,950 |
Source: Public Records
Map
Nearby Homes
- 261 Oak Crest Way
- 93 Northridge Terrace Unit 26
- 4069 S Pacific Hwy Unit 108
- 3957 S Pacific Hwy
- 174 Northridge Terrace
- 3555 S Pacific Hwy Unit SPC 131
- 3555 S Pacific Hwy Unit SPC 11
- 3555 S Pacific Hwy Unit 35
- 3555 S Pacific Hwy Unit 48
- 3555 S Pacific Hwy Unit SPC 121
- 3555 S Pacific Hwy Unit 113
- 3555 S Pacific Hwy Unit 139
- 3555 S Pacific Hwy Unit SPC 204
- 3555 S Pacific Hwy Unit SPC 205
- 1029 Brandon Way
- 137 N Phoenix Rd
- 612 N Main St
- 3459 S Pacific Hwy
- 510 N Main St
- 3431 S Pacific Hwy Unit SPC 98
- 244 Oak Crest Way
- 238 Oak Crest Way
- 250 Oak Crest Way
- 238 Oak Crest Way
- 250 Oak Crest Way
- 232 Oak Crest Way
- 232 Oak Crest Way
- 249 Oak Crest Way
- 256 Oak Crest Way
- 255 Oak Crest Way
- 243 Oak Crest Way
- 243 Oak Crest Way
- 261 Oak Crest Way Unit L11
- 226 Oak Crest Way
- 237 Oak Crest Way
- 267 Oak Crest Way
- 262 Oak Crest Way
- 296 Northridge Terrace
- 308 Northridge Terrace
- 231 Oak Crest Way