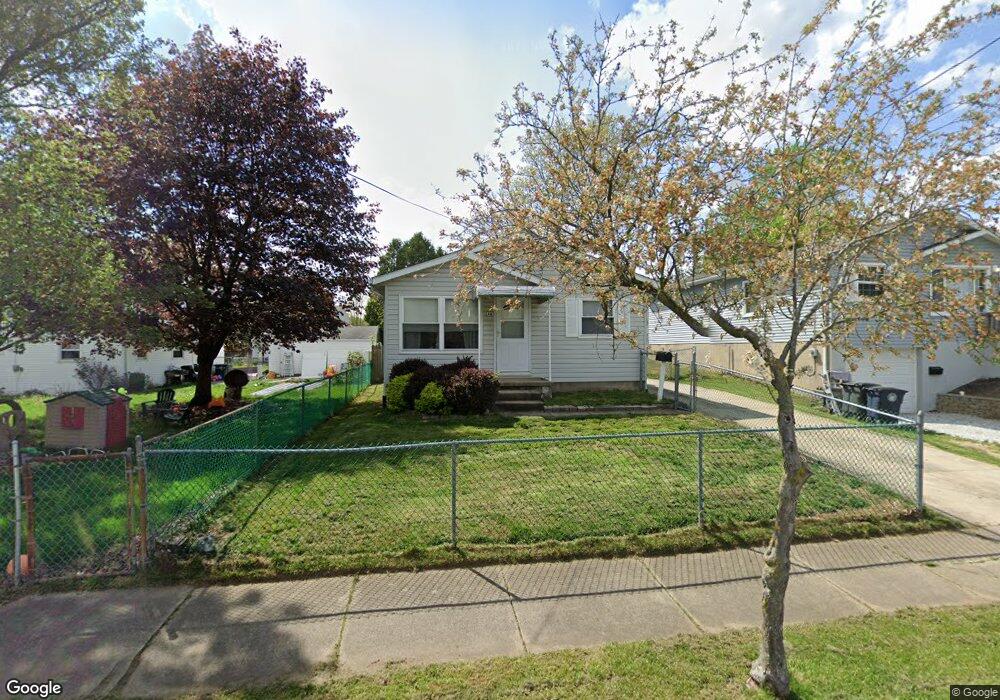
244 Pauline Ave Akron, OH 44312
Ellet NeighborhoodEstimated Value: $128,000 - $184,000
3
Beds
1
Bath
960
Sq Ft
$158/Sq Ft
Est. Value
About This Home
This home is located at 244 Pauline Ave, Akron, OH 44312 and is currently estimated at $151,394, approximately $157 per square foot. 244 Pauline Ave is a home located in Summit County with nearby schools including Ellet High School, Summit Academy Akron Elementary School, and Hatton Community Learning Center.
Ownership History
Date
Name
Owned For
Owner Type
Purchase Details
Closed on
Jul 13, 2006
Sold by
Hudson Patricia R
Bought by
Muffley William E and Muffley Nancy
Current Estimated Value
Home Financials for this Owner
Home Financials are based on the most recent Mortgage that was taken out on this home.
Original Mortgage
$85,500
Outstanding Balance
$50,955
Interest Rate
6.72%
Mortgage Type
Purchase Money Mortgage
Estimated Equity
$100,439
Purchase Details
Closed on
Jul 23, 2002
Sold by
Garber Donna M
Bought by
Hudson Patricia R
Home Financials for this Owner
Home Financials are based on the most recent Mortgage that was taken out on this home.
Original Mortgage
$65,000
Interest Rate
6.7%
Purchase Details
Closed on
Jun 11, 2001
Sold by
Buzzelli Guy G and Buzzelli Rebecca L
Bought by
Garber Donna M
Home Financials for this Owner
Home Financials are based on the most recent Mortgage that was taken out on this home.
Original Mortgage
$60,000
Interest Rate
7.16%
Create a Home Valuation Report for This Property
The Home Valuation Report is an in-depth analysis detailing your home's value as well as a comparison with similar homes in the area
Home Values in the Area
Average Home Value in this Area
Purchase History
| Date | Buyer | Sale Price | Title Company |
|---|---|---|---|
| Muffley William E | $90,000 | -- | |
| Hudson Patricia R | $82,700 | Chicago Title Insurance Comp | |
| Garber Donna M | $75,000 | Bond & Associates Title Agen |
Source: Public Records
Mortgage History
| Date | Status | Borrower | Loan Amount |
|---|---|---|---|
| Open | Muffley William E | $85,500 | |
| Previous Owner | Hudson Patricia R | $65,000 | |
| Previous Owner | Garber Donna M | $60,000 |
Source: Public Records
Tax History Compared to Growth
Tax History
| Year | Tax Paid | Tax Assessment Tax Assessment Total Assessment is a certain percentage of the fair market value that is determined by local assessors to be the total taxable value of land and additions on the property. | Land | Improvement |
|---|---|---|---|---|
| 2025 | $1,645 | $39,848 | $7,361 | $32,487 |
| 2024 | $1,645 | $39,848 | $7,361 | $32,487 |
| 2023 | $1,645 | $39,848 | $7,361 | $32,487 |
| 2022 | $1,372 | $28,669 | $5,296 | $23,373 |
| 2021 | $1,373 | $28,669 | $5,296 | $23,373 |
| 2020 | $1,353 | $28,670 | $5,300 | $23,370 |
| 2019 | $1,112 | $23,430 | $5,800 | $17,630 |
| 2018 | $1,097 | $23,430 | $5,800 | $17,630 |
| 2017 | $1,114 | $23,430 | $5,800 | $17,630 |
| 2016 | $1,115 | $23,430 | $5,800 | $17,630 |
| 2015 | $1,114 | $23,430 | $5,800 | $17,630 |
| 2014 | $1,105 | $23,430 | $5,800 | $17,630 |
| 2013 | $1,318 | $26,840 | $5,800 | $21,040 |
Source: Public Records
Map
Nearby Homes
- 307 Pauline Ave
- 2948 Trenton Rd
- 256 High Grove Blvd
- 0 Kreiner Ave
- 117 Kreiner Ave
- 47 Kreiner Ave
- 379 Stull Ave
- 412 Stevenson Ave
- 2863 Burnside St
- 6 Kreiner Ave
- 5 Kreiner Ave
- 440 Wirth Ave
- 490 Stevenson Ave
- 423 Stetler Ave
- 544 Dennison Ave
- 179 Davenport Ave
- 2528 Ogden Ave
- 48 Marion Ave
- V/L Marion Ave
- 233 Marion Ave
- 2871 Ellet Ave
- 236 Pauline Ave
- 263 Ripley Ave
- 265 Ripley Ave
- 251 Pauline Ave
- 228 Pauline Ave
- 255 Ripley Ave
- 255 Ripley Ave
- 243 Pauline Ave
- 2876 Ellet Ave
- 237 Pauline Ave
- 2872 Ellet Ave
- 241 Ripley Ave
- 231 Pauline Ave
- 2899 Ellet Ave
- 259 Pauline Ave
- 220 Pauline Ave
- 285 Ripley Ave
- 239 Ripley Ave
- 2851 Ellet Ave