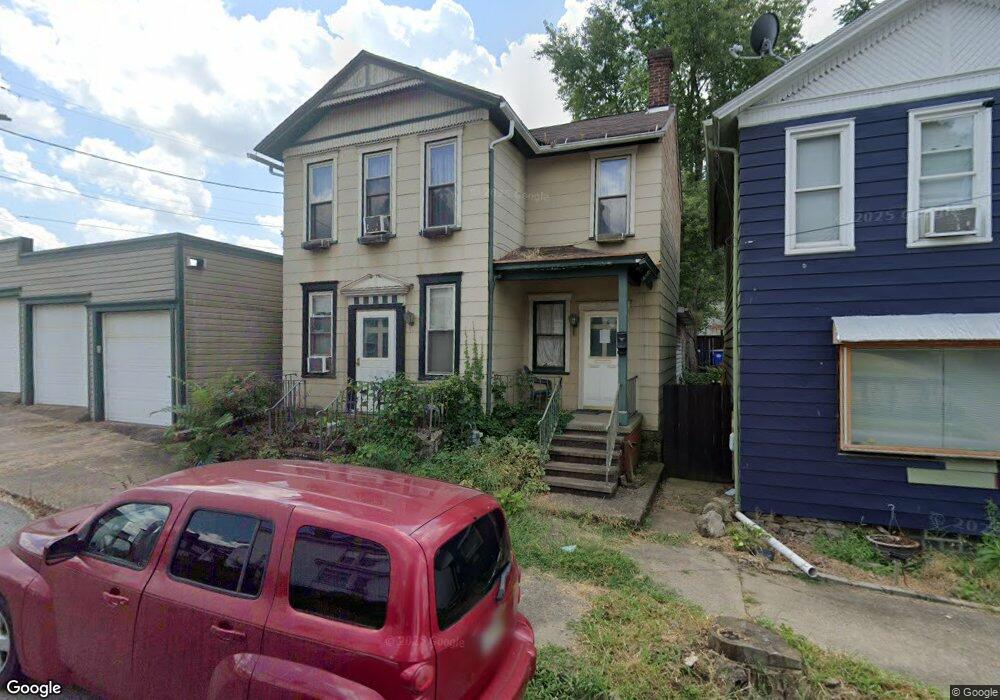
244 Ravine St East Liverpool, OH 43920
Estimated Value: $71,000 - $90,000
3
Beds
2
Baths
1,945
Sq Ft
$41/Sq Ft
Est. Value
About This Home
This home is located at 244 Ravine St, East Liverpool, OH 43920 and is currently estimated at $79,818, approximately $41 per square foot. 244 Ravine St is a home located in Columbiana County with nearby schools including Westgate Middle School, North Elementary School, and East Liverpool High School.
Ownership History
Date
Name
Owned For
Owner Type
Purchase Details
Closed on
May 4, 2004
Sold by
1St National Community Bank
Bought by
Horner David P and Horner David Rita
Current Estimated Value
Home Financials for this Owner
Home Financials are based on the most recent Mortgage that was taken out on this home.
Original Mortgage
$32,000
Interest Rate
5.5%
Mortgage Type
Seller Take Back
Purchase Details
Closed on
May 19, 2003
Sold by
Mccullough James E
Bought by
1St National Community Bank
Purchase Details
Closed on
Sep 18, 2000
Sold by
Reese Reese Susan A Susan A and Reese Susan A
Bought by
Mccullough James
Home Financials for this Owner
Home Financials are based on the most recent Mortgage that was taken out on this home.
Original Mortgage
$68,000
Interest Rate
8.05%
Purchase Details
Closed on
Aug 14, 1992
Bought by
Reese Susan A
Purchase Details
Closed on
Dec 14, 1990
Sold by
Reese Susan A
Bought by
Hilbert
Create a Home Valuation Report for This Property
The Home Valuation Report is an in-depth analysis detailing your home's value as well as a comparison with similar homes in the area
Home Values in the Area
Average Home Value in this Area
Purchase History
| Date | Buyer | Sale Price | Title Company |
|---|---|---|---|
| Horner David P | $40,000 | -- | |
| 1St National Community Bank | $40,000 | -- | |
| Mccullough James | -- | -- | |
| Reese Susan A | $33,000 | -- | |
| Hilbert | $5,000 | -- |
Source: Public Records
Mortgage History
| Date | Status | Borrower | Loan Amount |
|---|---|---|---|
| Closed | Horner David P | $32,000 | |
| Previous Owner | Mccullough James | $68,000 |
Source: Public Records
Tax History Compared to Growth
Tax History
| Year | Tax Paid | Tax Assessment Tax Assessment Total Assessment is a certain percentage of the fair market value that is determined by local assessors to be the total taxable value of land and additions on the property. | Land | Improvement |
|---|---|---|---|---|
| 2024 | $569 | $13,860 | $420 | $13,440 |
| 2023 | $570 | $13,860 | $420 | $13,440 |
| 2022 | $570 | $13,860 | $420 | $13,440 |
| 2021 | $515 | $11,490 | $390 | $11,100 |
| 2020 | $516 | $11,490 | $390 | $11,100 |
| 2019 | $516 | $11,490 | $390 | $11,100 |
| 2018 | $499 | $10,430 | $350 | $10,080 |
| 2017 | $525 | $10,430 | $350 | $10,080 |
| 2016 | $524 | $10,190 | $280 | $9,910 |
| 2015 | $498 | $10,190 | $280 | $9,910 |
| 2014 | $492 | $10,190 | $280 | $9,910 |
Source: Public Records
Map
Nearby Homes
- 319 Thompson Ave
- 315 Vine St
- 334 & 336 Thompson Ave
- 406 Vine St
- 420 Vine St
- 410 Blakely St
- 812 Bradshaw Ave
- 422 Grove Alley
- 515 E 6th St
- 513 E 6th St
- 938 Ambrose Ave
- 755 Minerva St
- 1001 Ambrose Ave
- 739 Avondale St
- 820 Chester St
- 929 Bank St
- 805 Rigby St
- 807 Rigby St
- 122 Carolina Ave
- 152 Pennsylvania Ave
- 240 Ravine St
- 246 Ravine St
- 238 Ravine St
- 235 Thompson Ave
- 229 Thompson Ave
- 303 Thompson Ave
- 243 Pennsylvania Ave
- 243 Pennsylvania Ave
- 257 Pennsylvania Ave
- 230 Ravine St
- 245 Pennsylvania Ave
- 307 Thompson Ave
- 241 Pennsylvania Ave
- 235 Pennsylvania Ave
- 311 Thompson Ave
- 300 Thompson Ave
- 231 Pennsylvania Ave
- 308 Thompson Ave
- 223 Thompson Ave
- 313 Thompson Ave