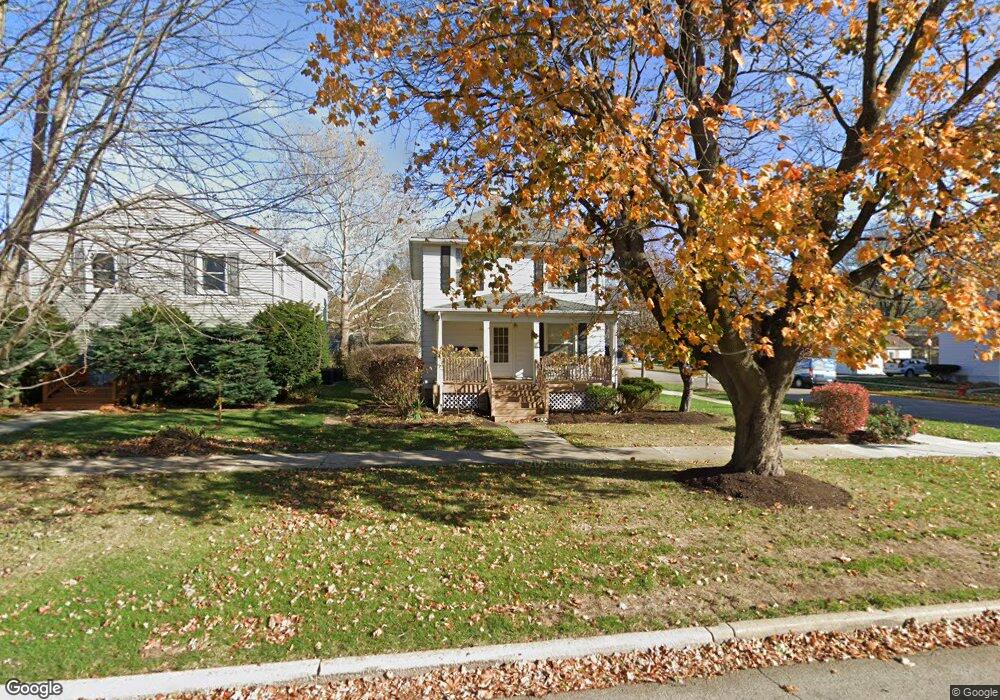
244 S Commonwealth Ave Aurora, IL 60506
University Neighbors NeighborhoodEstimated Value: $312,085 - $331,000
4
Beds
--
Bath
1,282
Sq Ft
$254/Sq Ft
Est. Value
About This Home
This home is located at 244 S Commonwealth Ave, Aurora, IL 60506 and is currently estimated at $325,021, approximately $253 per square foot. 244 S Commonwealth Ave is a home located in Kane County with nearby schools including Freeman Elementary School, Washington Middle School, and West Aurora High School.
Ownership History
Date
Name
Owned For
Owner Type
Purchase Details
Closed on
Jul 31, 1998
Sold by
Belaski John A and Belaski Betty A
Bought by
Schufer Steven C
Current Estimated Value
Home Financials for this Owner
Home Financials are based on the most recent Mortgage that was taken out on this home.
Original Mortgage
$112,000
Outstanding Balance
$23,630
Interest Rate
7.05%
Estimated Equity
$301,391
Purchase Details
Closed on
Dec 30, 1996
Sold by
Peippo Erkki M and Peippo Erik
Bought by
Belaski John A and Belaski Betty A
Home Financials for this Owner
Home Financials are based on the most recent Mortgage that was taken out on this home.
Original Mortgage
$95,120
Interest Rate
7.58%
Purchase Details
Closed on
Mar 24, 1995
Sold by
Isaacs William M
Bought by
Peippo Erkki M
Home Financials for this Owner
Home Financials are based on the most recent Mortgage that was taken out on this home.
Original Mortgage
$110,992
Interest Rate
8.82%
Mortgage Type
FHA
Create a Home Valuation Report for This Property
The Home Valuation Report is an in-depth analysis detailing your home's value as well as a comparison with similar homes in the area
Home Values in the Area
Average Home Value in this Area
Purchase History
| Date | Buyer | Sale Price | Title Company |
|---|---|---|---|
| Schufer Steven C | $135,000 | Chicago Title Insurance Co | |
| Belaski John A | $119,000 | Law Title Insurance Co Inc | |
| Peippo Erkki M | $112,000 | -- |
Source: Public Records
Mortgage History
| Date | Status | Borrower | Loan Amount |
|---|---|---|---|
| Open | Schufer Steven C | $112,000 | |
| Previous Owner | Belaski John A | $95,120 | |
| Previous Owner | Peippo Erkki M | $110,992 |
Source: Public Records
Tax History Compared to Growth
Tax History
| Year | Tax Paid | Tax Assessment Tax Assessment Total Assessment is a certain percentage of the fair market value that is determined by local assessors to be the total taxable value of land and additions on the property. | Land | Improvement |
|---|---|---|---|---|
| 2024 | $5,899 | $90,506 | $13,869 | $76,637 |
| 2023 | $5,556 | $80,867 | $12,392 | $68,475 |
| 2022 | $6,000 | $73,784 | $11,307 | $62,477 |
| 2021 | $5,728 | $68,694 | $10,527 | $58,167 |
| 2020 | $5,412 | $63,806 | $9,778 | $54,028 |
| 2019 | $5,491 | $62,157 | $9,060 | $53,097 |
| 2018 | $5,047 | $56,558 | $8,380 | $48,178 |
| 2017 | $5,053 | $55,100 | $7,721 | $47,379 |
| 2016 | $4,733 | $50,552 | $6,618 | $43,934 |
| 2015 | -- | $48,649 | $5,691 | $42,958 |
| 2014 | -- | $45,459 | $5,230 | $40,229 |
| 2013 | -- | $42,362 | $5,261 | $37,101 |
Source: Public Records
Map
Nearby Homes
- 237 Ingleside Ave
- 149 S Gladstone Ave
- 164 S Calumet Ave
- 203 S Calumet Ave
- 425 Ingleside Ave
- 175 S Harrison Ave
- 537 Hartford Ave
- 1143 Ridgeway Ave
- 931 W Downer Place
- 823 Lenwood Ct
- 231 W Downer Place
- 850 W Galena Blvd
- 930 W New York St Unit 932
- 652 Hartford Ave
- 710 W Downer Place
- 943 Charles St
- 900 Charles St
- 310-312 Prairie St
- 625 S Lake St
- 809 W Park Ave
- 240 S Commonwealth Ave
- 238 S Commonwealth Ave
- 300 S Commonwealth Ave
- 1114 Marseillaise Place
- 245 S Fordham Ave
- 232 S Commonwealth Ave
- 241 S Fordham Ave
- 304 S Commonwealth Ave
- 239 S Fordham Ave
- 1106 Marseillaise Place
- 228 S Commonwealth Ave
- 233 S Fordham Ave
- 243 S Commonwealth Ave
- 305 S Fordham Ave
- 237 S Commonwealth Ave
- 224 S Commonwealth Ave
- 231 S Fordham Ave
- 301 S Commonwealth Ave
- 309 S Fordham Ave
- 312 S Commonwealth Ave