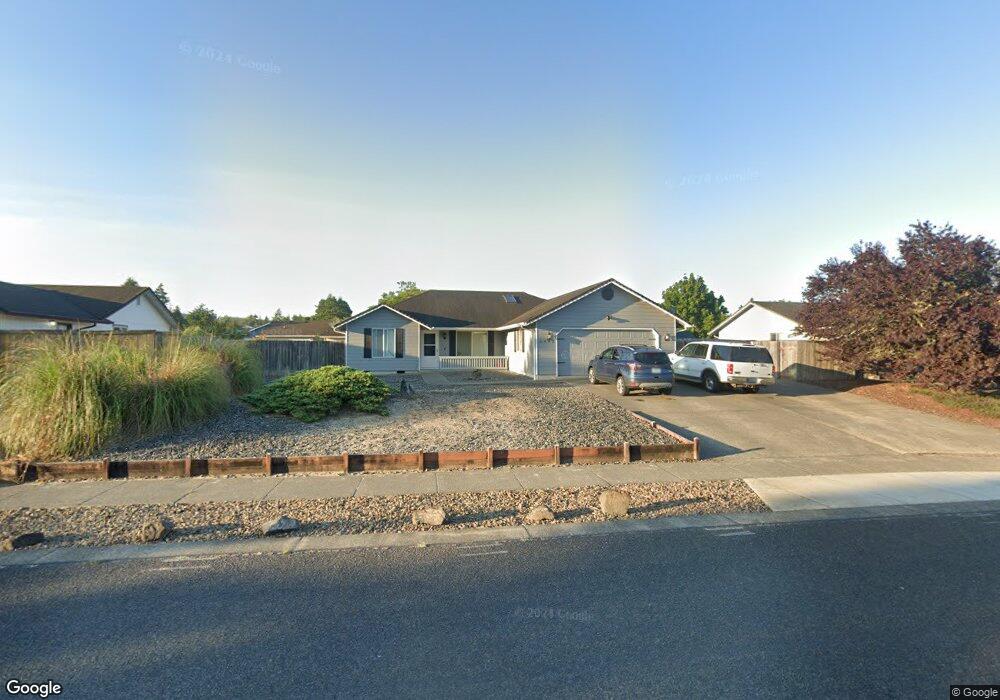
2440 16th St Florence, OR 97439
Estimated Value: $388,000 - $485,000
3
Beds
2
Baths
1,410
Sq Ft
$312/Sq Ft
Est. Value
About This Home
This home is located at 2440 16th St, Florence, OR 97439 and is currently estimated at $439,706, approximately $311 per square foot. 2440 16th St is a home located in Lane County with nearby schools including Siuslaw Elementary School, Siuslaw Middle School, and Siuslaw High School.
Ownership History
Date
Name
Owned For
Owner Type
Purchase Details
Closed on
Aug 20, 2015
Sold by
Zurflueh Nancy M
Bought by
Pease Dennis and Pease Debra
Current Estimated Value
Home Financials for this Owner
Home Financials are based on the most recent Mortgage that was taken out on this home.
Original Mortgage
$157,560
Interest Rate
3.97%
Mortgage Type
Purchase Money Mortgage
Purchase Details
Closed on
Jul 12, 2002
Sold by
Trepper Martin and Trepper Pamela M
Bought by
Zurflueh Wayne M and Zurflueh Nancy M
Purchase Details
Closed on
Jul 27, 2000
Sold by
Maxwell Construction Inc
Bought by
Trepper Martin and Trepper Pamela M
Create a Home Valuation Report for This Property
The Home Valuation Report is an in-depth analysis detailing your home's value as well as a comparison with similar homes in the area
Home Values in the Area
Average Home Value in this Area
Purchase History
| Date | Buyer | Sale Price | Title Company |
|---|---|---|---|
| Pease Dennis | $195,000 | First American Title | |
| Zurflueh Wayne M | $146,000 | Western Pioneer Title Co | |
| Trepper Martin | $121,000 | Western Pioneer Title Co |
Source: Public Records
Mortgage History
| Date | Status | Borrower | Loan Amount |
|---|---|---|---|
| Closed | Pease Dennis | $157,560 |
Source: Public Records
Tax History Compared to Growth
Tax History
| Year | Tax Paid | Tax Assessment Tax Assessment Total Assessment is a certain percentage of the fair market value that is determined by local assessors to be the total taxable value of land and additions on the property. | Land | Improvement |
|---|---|---|---|---|
| 2024 | $3,212 | $235,367 | -- | -- |
| 2023 | $3,212 | $228,512 | $0 | $0 |
| 2022 | $2,997 | $221,857 | $0 | $0 |
| 2021 | $2,935 | $215,396 | $0 | $0 |
| 2020 | $2,858 | $209,123 | $0 | $0 |
| 2019 | $2,751 | $203,033 | $0 | $0 |
| 2018 | $2,757 | $191,379 | $0 | $0 |
| 2017 | $2,659 | $191,379 | $0 | $0 |
| 2016 | $2,583 | $185,805 | $0 | $0 |
| 2015 | $2,528 | $180,393 | $0 | $0 |
| 2014 | $2,501 | $175,139 | $0 | $0 |
Source: Public Records
Map
Nearby Homes