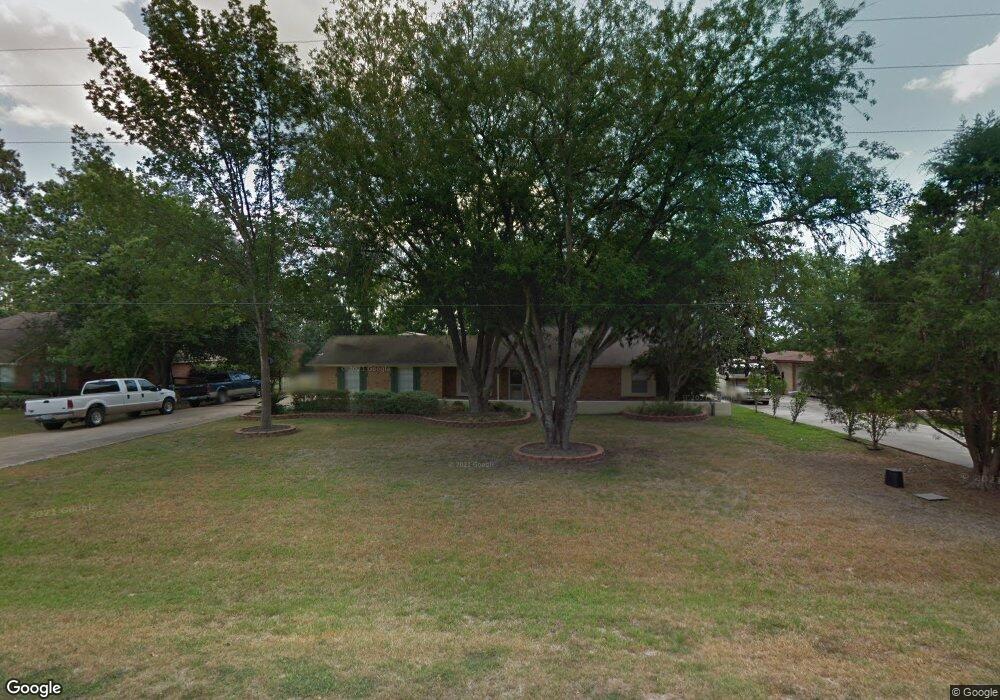
24406 Rolling Meadow Dr Tomball, TX 77375
Hufsmith NeighborhoodEstimated Value: $324,000 - $378,000
3
Beds
2
Baths
1,756
Sq Ft
$199/Sq Ft
Est. Value
About This Home
This home is located at 24406 Rolling Meadow Dr, Tomball, TX 77375 and is currently estimated at $348,889, approximately $198 per square foot. 24406 Rolling Meadow Dr is a home located in Harris County with nearby schools including Creekview Elementary School, Creekside Park Junior High School, and Tomball High School.
Ownership History
Date
Name
Owned For
Owner Type
Purchase Details
Closed on
Nov 3, 2020
Sold by
Southworth Brenda
Bought by
Surrctt Paige M
Current Estimated Value
Home Financials for this Owner
Home Financials are based on the most recent Mortgage that was taken out on this home.
Original Mortgage
$278,350
Outstanding Balance
$248,136
Interest Rate
2.9%
Mortgage Type
New Conventional
Estimated Equity
$100,753
Purchase Details
Closed on
Aug 8, 2008
Sold by
Clink Jeffrey K and Clink Jo Ann M
Bought by
Southworth Brenda
Home Financials for this Owner
Home Financials are based on the most recent Mortgage that was taken out on this home.
Original Mortgage
$141,432
Interest Rate
6.47%
Mortgage Type
FHA
Create a Home Valuation Report for This Property
The Home Valuation Report is an in-depth analysis detailing your home's value as well as a comparison with similar homes in the area
Home Values in the Area
Average Home Value in this Area
Purchase History
| Date | Buyer | Sale Price | Title Company |
|---|---|---|---|
| Surrctt Paige M | -- | None Available | |
| Southworth Brenda | -- | Stewart Title Houston Div |
Source: Public Records
Mortgage History
| Date | Status | Borrower | Loan Amount |
|---|---|---|---|
| Open | Surrctt Paige M | $278,350 | |
| Previous Owner | Southworth Brenda | $141,432 |
Source: Public Records
Tax History Compared to Growth
Tax History
| Year | Tax Paid | Tax Assessment Tax Assessment Total Assessment is a certain percentage of the fair market value that is determined by local assessors to be the total taxable value of land and additions on the property. | Land | Improvement |
|---|---|---|---|---|
| 2025 | $4,289 | $299,736 | $51,212 | $248,524 |
| 2024 | $4,289 | $299,736 | $51,212 | $248,524 |
| 2023 | $4,289 | $293,119 | $45,522 | $247,597 |
| 2022 | $5,908 | $293,119 | $45,522 | $247,597 |
| 2021 | $5,677 | $293,119 | $45,522 | $247,597 |
| 2020 | $5,333 | $257,661 | $39,832 | $217,829 |
| 2019 | $5,009 | $224,794 | $27,313 | $197,481 |
| 2018 | $2,677 | $224,794 | $27,313 | $197,481 |
| 2017 | $4,781 | $214,876 | $27,313 | $187,563 |
| 2016 | $4,638 | $214,876 | $27,313 | $187,563 |
| 2015 | $3,452 | $204,276 | $27,313 | $176,963 |
| 2014 | $3,452 | $178,197 | $27,313 | $150,884 |
Source: Public Records
Map
Nearby Homes
- 24402 Deep Meadow Dr
- 000 Na
- 24236 Stuebner Airline Rd
- 25003 Waterstone Estates Cir N
- 23719 Plantation Pines Ln
- 23730 Hiddenbriar Loop
- 23635 Plantation Pines Ln
- 23623 Plantation Pines Ln
- 23618 Plantation Pines Ln
- 10703 Catclaw Ct
- 25706 Boxwood Hedge Ln
- 1231 Hidden Oaks Dr
- Portico D - with Bonus Suite Plan at Winfrey Estates
- Palazzo C - with Bonus Suite Plan at Winfrey Estates
- Palazzo A - Single-Level Plan at Winfrey Estates
- Promenade III A - Single-Level Plan at Winfrey Estates
- Portico E - Single-Level Plan at Winfrey Estates
- Portico A - Single-Level Plan at Winfrey Estates
- Palazzo B - Single-Level Plan at Winfrey Estates
- Promenade III B - Single-Level Plan at Winfrey Estates
- 24410 Rolling Meadow Dr
- 24402 Rolling Meadow Dr
- 24414 Rolling Meadow Dr
- 10807 Hufsmith Kuykendahl Rd
- 24407 Rolling Meadow Dr
- 24411 Rolling Meadow Dr
- 24418 Rolling Meadow Dr
- 24403 Rolling Meadow Dr
- 24415 Rolling Meadow Dr
- 24419 Rolling Meadow Dr
- 24502 Rolling Meadow Dr
- 24506 Rolling Meadow Dr
- 24423 Rolling Meadow Dr
- 24406 Deep Meadow Dr
- 24410 Deep Meadow Dr
- 24404 Deep Meadow Dr
- 24414 Deep Meadow Dr
- 24510 Rolling Meadow Dr
- 24418 Deep Meadow Dr
- 24418 Deep Meadow Dr